| Audience | Marketers and lifecycle teams optimizing active AID agents |
| Prerequisites |
Smart Suppression predicts the incremental impact of each message for each user, then holds back low-value sends while letting high-impact messages through. You maintain conversions while sending fewer messages and reducing unsubscribes.
What you'll learn
- Understand how Smart Suppression scores and suppresses messages
- Enable Smart Suppression in your agent
- Configure suppression levels and scope
- Monitor suppression performance with built-in dashboards
- Recognize healthy patterns and investigate anomalies
How Smart Suppression works
The suppression decision
During each AID run, the model scores every user in the eligible audience based on how likely each send is to drive the outcome you care about. Before dispatching a message, AID applies a suppression check:
- Users whose score falls in the bottom X% (your configured suppression level) are held back for that run.
- Users with higher scores receive the best-scoring message variant.
- Suppressed users are not penalized — they remain eligible and are re-evaluated in every subsequent run. Suppressed users do not count toward your send volume.
In plain terms: for every potential send, the model asks "If we send this message right now, how likely is it to drive the outcome we care about?" Messages scored as unlikely to drive that outcome get suppressed; higher-scoring ones go through. You set the suppression level based on your volume and performance goals, and the AI handles the per-user, per-message decisioning.
How suppressed users re-enter the send pool
Suppression is self-correcting — suppressed users naturally work their way back into the send pool over time:
- The model tracks how recently a user has been messaged. The longer someone goes without a message, the higher their predicted score becomes, so suppression effectively undoes itself over time.
- Users near the filter boundary have a roughly 50/50 chance of being included on any given run, so even lower-scoring users get messaged periodically through natural variation.
- No user ever has a 0% chance of being sent. The system enforces a minimum send probability (currently 1%), which means every user in the audience will eventually receive a message.
In a typical agent, only around 3–5% of users go unsent over a 30-day window — and these are the lowest-scoring users who simply haven't yet come up in the probabilistic draw. They remain in the pool and will be re-engaged as their score improves.
What the model looks at
The model draws on your existing warehouse data to form its predictions. It considers signals like:
| Signal type | Examples |
|---|---|
| Purchase and transaction history | Recent purchases, order frequency, spend patterns |
| Browsing and product interactions | Pages viewed, items added to cart, search behavior |
| Message engagement | Opens, clicks, and response history for prior sends |
| Recency features | Days since last message, last purchase, last session |
| User-level context | Any custom fields passed as data fields in the AID configuration |
The richer and more current these signals are, the more precisely the model can identify which sends will drive incremental value.
Smart Suppression relies on the features passed into the AID agent as data fields. At minimum, include:
- Message engagement history (clicks) for the relevant channel
- Recency signals (days since last click, last purchase, last session)
- Purchase or transaction history relevant to the goal being optimized
- User lifecycle stage or segment identifier, if applicable
Suppression will function without all of these, but prediction accuracy improves meaningfully as more signals are added.
How suppression differs from other exclusion mechanisms
Smart Suppression is distinct from upstream audience filters or frequency caps:
| Mechanism | Controlled by | Effect |
|---|---|---|
| Audience filter | Sync or segment definition | User never enters the AID run |
| Frequency cap | AID agent configuration | User excluded after N messages in a set window |
| Smart Suppression | AID model (per-run) | User enters the run but message is withheld based on predicted outcome score |
Frequency caps and Smart Suppression operate independently and stack. A user must first pass the frequency cap check before entering the suppression evaluation. If a user is within their cap limit but the model predicts a low likelihood of driving the outcome, Smart Suppression will still hold back the message.
Enable Smart Suppression
- Open your agent and go to the Configuration tab.
- Scroll to the Smart suppression (optional) section.
- Select Enabled to activate suppression.
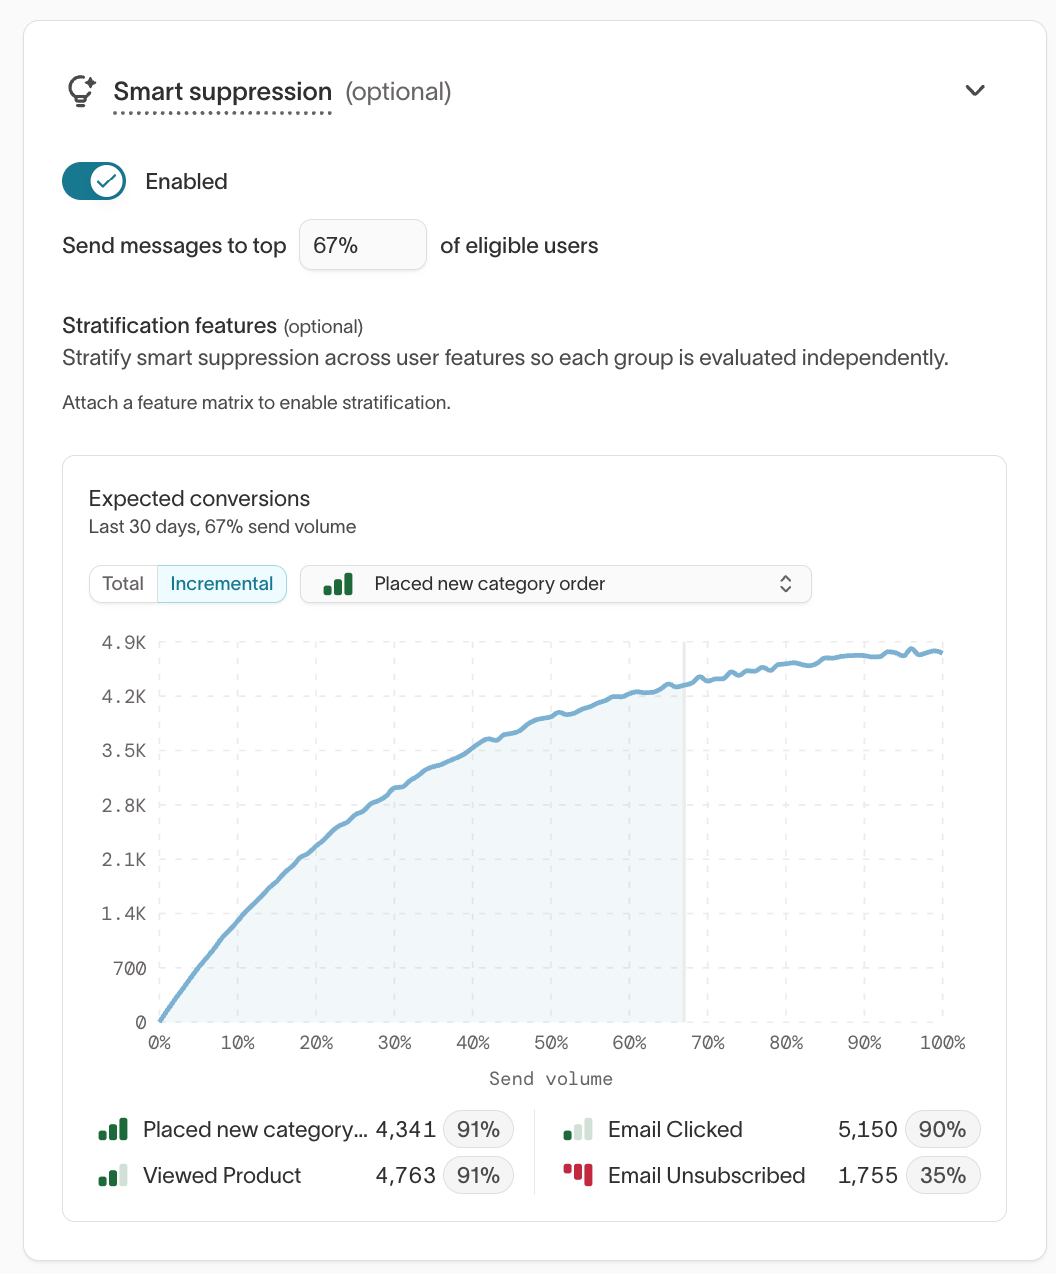
- Set the percentage of eligible users to send to (for example, send messages to the top 67%). Select Save changes.
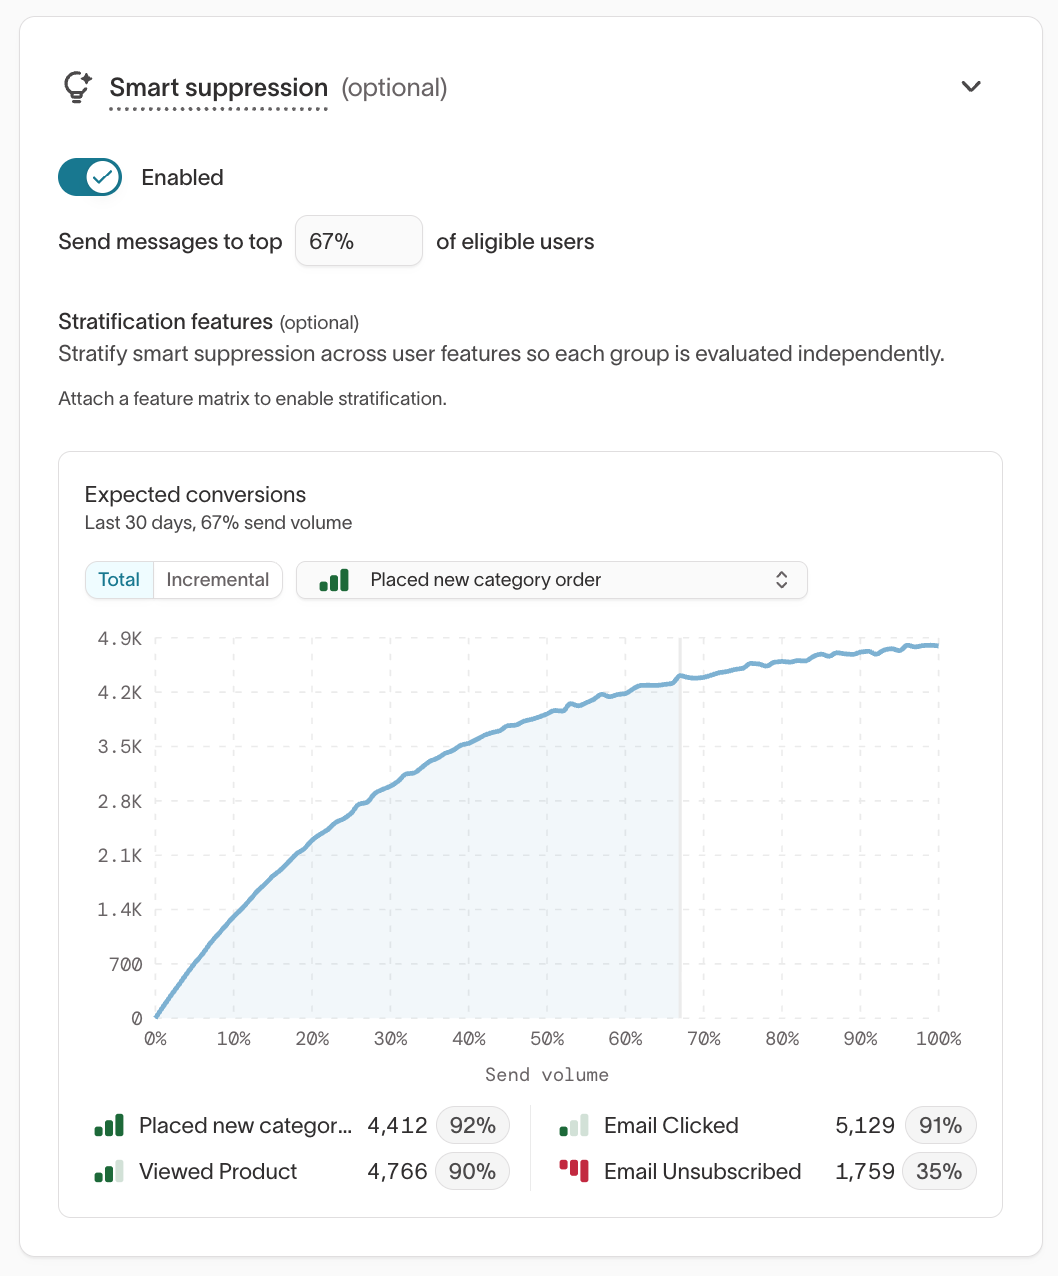
You'll see a predicted performance curve update once the model has enough data to estimate incremental lift. Initial calibration typically occurs over the first two weeks, as the model accumulates enough outcome data to make confident predictions. During this period, suppression rates may be higher or lower than steady-state.
Smart Suppression requires at least one outcome goal defined in your agent. Make sure goals are configured under Goals in the agent's Configuration tab before enabling suppression.
To disable Smart Suppression, toggle it off in the same section. All users in the eligible audience will then receive a message regardless of predicted outcome score. This is generally not recommended for live campaigns, as it removes the engagement protection suppression provides. If you want to temporarily disable it for testing, coordinate with your Hightouch team.
Configure suppression levels and scope
Set the suppression level
Suppression is configured as a percentile threshold — you choose to send to only the top X% of users by predicted outcome score for a given run. For example:
| Threshold | Behavior |
|---|---|
| Send to top 80% | Broad sending with light filtering — the bottom 20% is suppressed |
| Send to top 50% | Balanced approach, targeting users above the median score |
| Send to top 30% | Highly selective sending, prioritizing only the highest-scoring users |
A lower send percentage (more aggressive suppression) means fewer messages sent and higher average send quality — better for protecting engagement health and unsubscribe rates. A higher send percentage means broader reach — better when volume is a priority. The right balance depends on your channel, audience, and conversion baseline.
Start conservatively (for example, send to the top 80–90%) and lower the threshold gradually as your agent gathers more data. Work with your Hightouch team to calibrate during setup.
Choose a suppression scope
Suppression can be configured at different levels depending on how your AID agent is set up:
| Scope | Behavior |
|---|---|
| Agent-level | A single suppression level applies across all variants and audiences within the agent |
| Feature-level | Suppression evaluated independently per feature, using stratification features to group users — useful when features target meaningfully different behaviors |
To configure feature-level suppression, use the Stratification features option in the Smart Suppression configuration. This requires a feature matrix attached to the agent. Once attached, you can select a feature from the matrix to group users — suppression is then evaluated independently within each group.
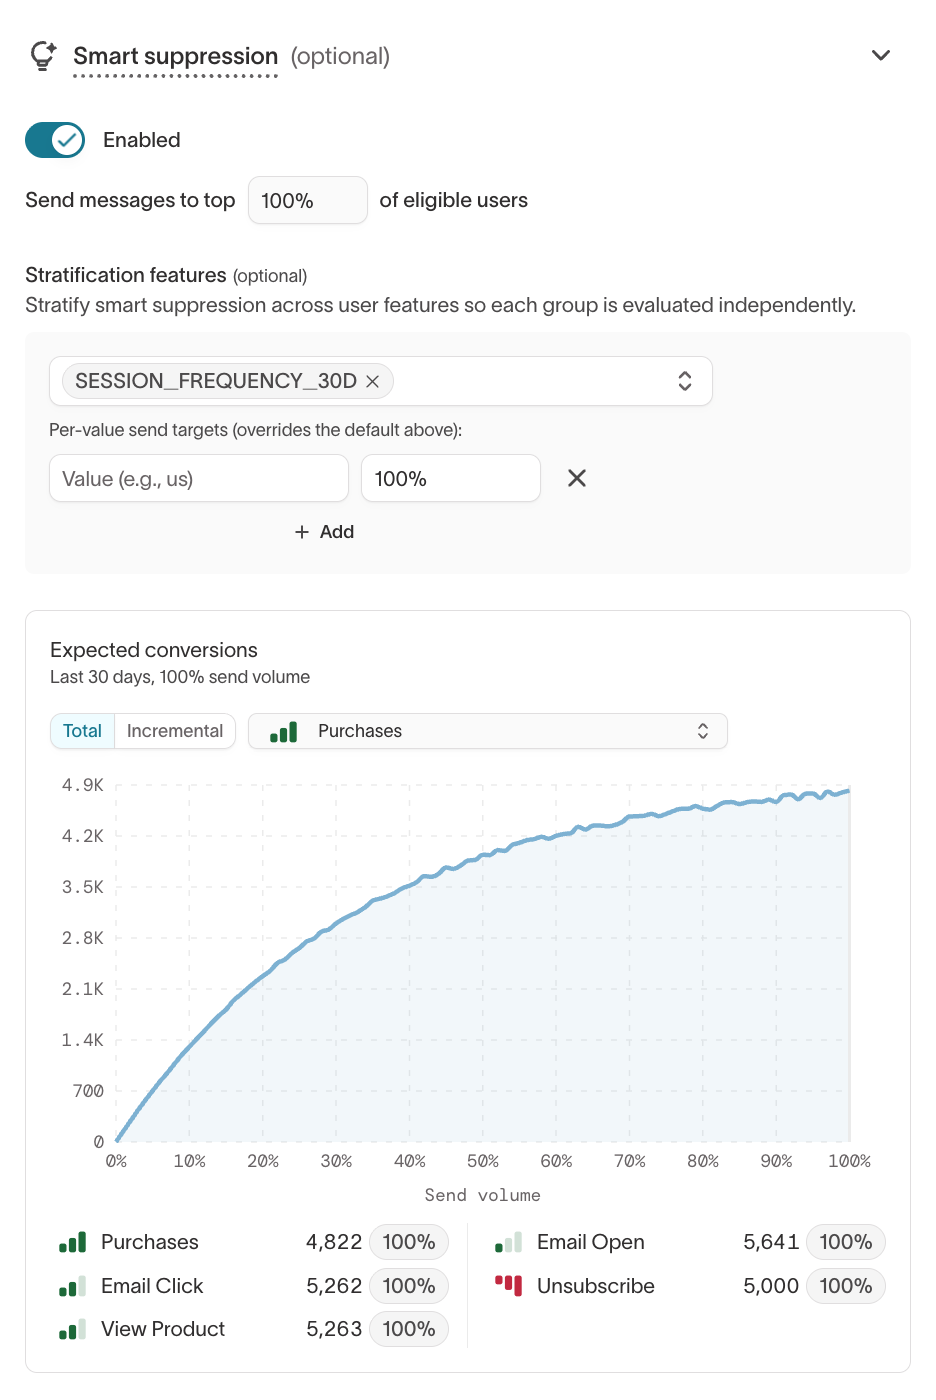
After selecting a stratification feature, you can set per-value send targets that override the default suppression level. For example, if you stratify by SESSION_FREQUENCY_30D, you could send to 90% of high-frequency users but only 60% of low-frequency users. Use + Add to define a target for each value. Values without an explicit target use the default percentage.
Work with your Hightouch team to determine which scope and feature are appropriate for your agent design.
Monitor suppression performance
After enabling Smart Suppression, monitor its performance from the agent's Overview tab. Go to AI Decisioning → Agents, select your agent, and open the Overview tab to access the following dashboards.
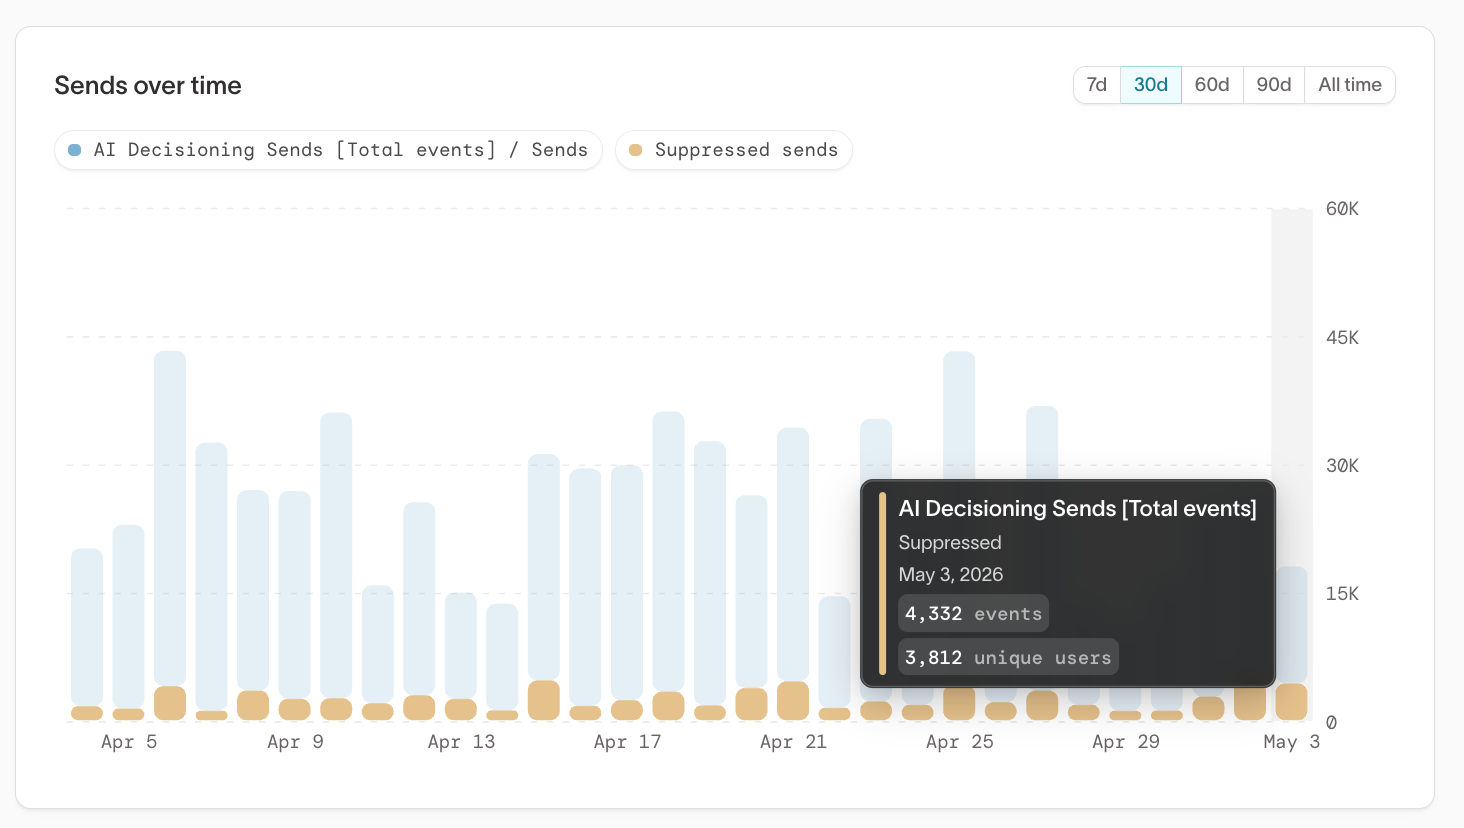
Sends over time
The Sends over time chart shows total AI Decisioning sends alongside suppressed sends on a daily basis. This lets you see the volume of messages being held back relative to what's going out, and spot any sudden shifts in suppression rate that might warrant investigation.
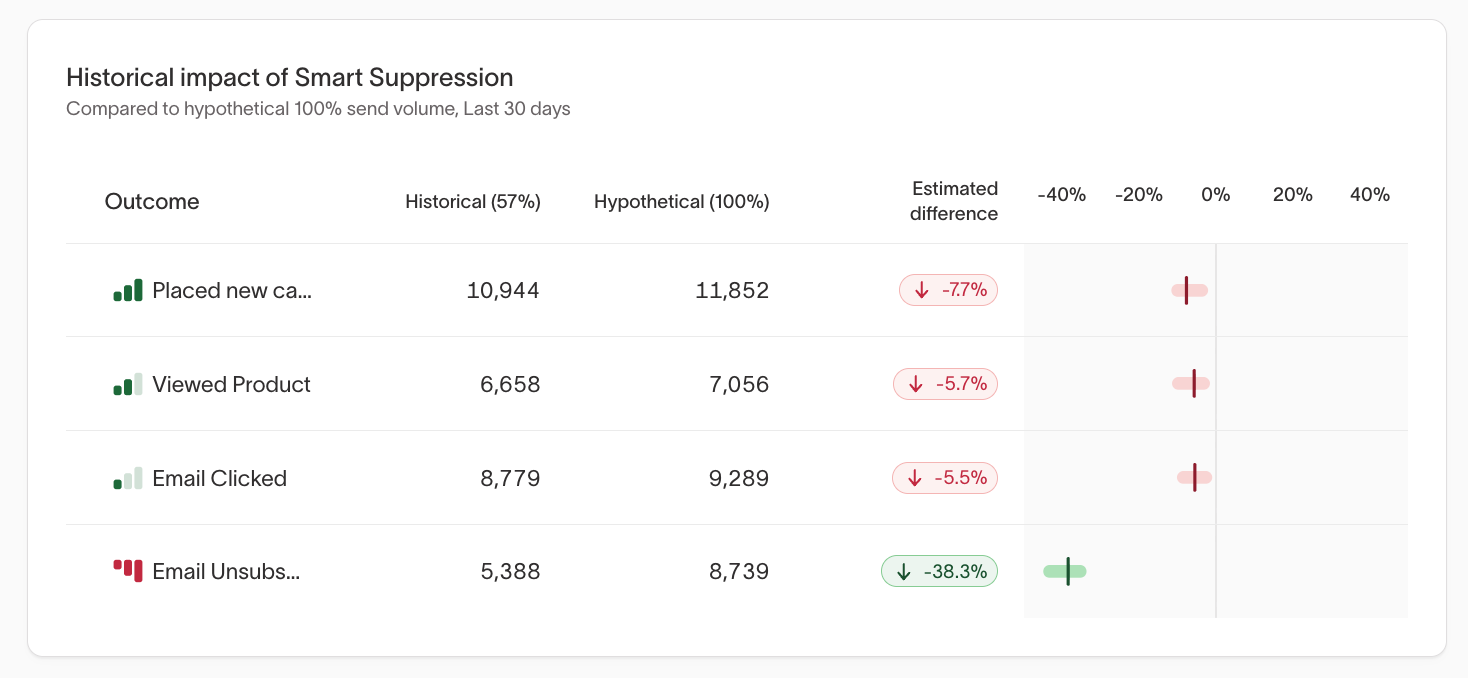
Historical impact of Smart Suppression
This table compares actual outcomes at your current send volume against a hypothetical scenario where 100% of users were sent to. For each outcome — conversions, clicks, unsubscribes — it shows the estimated difference and statistical confidence. A negative unsubscribe number (highlighted in green) is the key signal: it means suppression is reducing fatigue without meaningfully sacrificing conversions.
Expected conversions: Total view
The Expected conversions chart lets you explore the tradeoff between send volume and outcomes at different suppression levels. The Total view shows cumulative conversions as send volume increases from 0% to 100%. The curve typically flattens well before 100%, indicating that a large share of conversions are captured by the highest-lift users, and that sending to the full audience adds relatively little incremental value.
Expected conversions: Incremental view
The Incremental view shows the marginal conversion impact of each additional percentage of send volume. When this line turns negative, it means sending to those additional users is predicted to reduce net conversions — typically because the messages drive unsubscribes or suppress future engagement. This view helps identify the optimal send volume for your agent: the point where incremental benefit starts to diminish or reverse.
Check if suppression is working
You should generally expect to see:
- Conversion rates among sent users equal to or higher than your pre-AID baseline
- A stable or declining unsubscribe rate over time
- Suppressed users converting at lower rates than sent users in the same window
Signs to investigate
The following patterns may indicate a suppression configuration that needs tuning:
| Pattern | Likely cause |
|---|---|
| Suppression rate is very high and send volume is lower than expected | Suppression level may be set too aggressively |
| Suppression rate near 0% | Threshold may be too low, or data signals may not be discriminating enough |
| No meaningful difference in conversion rate between sent and suppressed users | Model may need additional features or retraining |
| Rising unsubscribe rates | Suppression may not be filtering aggressively enough for a particular segment |
Best practices
- Enable Smart Suppression once the agent has enough message and outcome data to produce stable predictions. Predictive charts typically appear after about two weeks, but the exact timing depends on signal volume.
- Review the Expected conversions and Historical impact views regularly to tune your suppression threshold over time.
- Use scheduling alongside Smart Suppression to manage quiet hours and send frequency.
- Use tags to analyze which message themes and creative types perform best in Insights.