We recently released an upgraded alerting system. If you’d like access to the new features, please
Overview
Hightouch alerting helps you monitor sync health at a glance. Each sync is evaluated against a set of alert triggers that check for issues like failed runs, rejected rows, slow performance, or unexpected data drops.
Rather than showing only the result of the last run, each sync now displays a rollup of its current alerting state. If no triggers are alerting, the sync shows “No alerts.” If one or more are in a CRITICAL or WARNING state, you’ll see the number of active alerts.
This gives you a more accurate picture of whether the sync is healthy, degraded, or needs attention—regardless of whether it ran recently.
Each alert is tracked at the trigger level. You can fine-tune thresholds, mute specific conditions, or change recipient settings either in bulk (per destination) or individually (per sync).
Alerts vs. notifications
In Hightouch, an alert is a signal that a sync has entered a CRITICAL or WARNING state. A notification is what you receive (via email, Slack, SMS, or PagerDuty) when someone is subscribed to alerts at that level.
- All syncs have fatal error and rejected row triggers enabled by default. These cannot be disabled, but their thresholds can be customized.
- You’ll only receive a notification if a recipient is configured to receive alerts at that level.
- Recipients can be set at the destination level or overridden per sync.
- Each recipient can be configured to receive only CRITICAL alerts, or CRITICAL + WARNING.
When notifications are sent
You receive one notification per trigger status change, not per run.
For example:
- A sync triggers a rejected row alert → you receive one WARNING notification
- It keeps rejecting rows in future runs → no new alerts
- It rejects many more rows in a future run, exceeding the CRITICAL threshold → you receive one CRITICAL notification
- It recovers → you receive a recovery alert
- Later, it fatally fails → you receive one CRITICAL notification
This avoids noise while still ensuring you’re informed when something breaks or escalates.
Configuration
Every sync starts with default alerting enabled:
- Fatal error alerts: CRITICAL, triggered by syncs that can’t run due to infrastructure or config issues.
- Rejected row alerts: WARNING, triggered by row-level sync failures.
These default triggers are always active but can be tuned with custom thresholds.
How to manage alert configuration
You can manage alerting behavior at two levels:
1. At the destination level (bulk configuration)
- Navigate to the Destinations page.
- Select a destination and go to the Alerting tab.
- Set default recipients and trigger thresholds for all syncs using this destination.
2. At the individual sync level (override)
- Navigate to the Syncs page and open a sync.
- Go to the Alerting tab.
- Adjust trigger thresholds and notification recipients for that sync.
Changes here override any destination-level settings for this sync.
When monitors are changed or enabled/disabled, the changes will take effect the next time the trigger thresholds are evaluated; after the next sync run, or approximately every five minutes for time-based monitors.
Trigger types
Each sync supports multiple trigger types that determine when it should be considered alerting. These conditions monitor for issues like failed runs, data quality problems, and unexpected changes in sync behavior.
All syncs have fatal error and rejected row triggers enabled by default. These cannot be disabled, but their thresholds can be customized. Other triggers are optional and configurable at the destination or sync level.
Fatal errors
Detects infrastructure- or configuration-level sync failures that prevent a run from completing.
-
Default behavior: Alert if one or more sync runs fail to finish
-
Custom options: Configure a higher failure streak (e.g., alert only after 3 consecutive failures)
-
Evaluation timing: Evaluated immediately after each sync run ends, regardless of whether the run completed successfully
-
Metric source: Sync run status (completed, failed)
-
Logic: Evaluates the number of consecutive failed runs and compares to the configured threshold. A sync run is considered "fatally failed" if it could not complete due to issues like:
- Unreachable source or destination
- Invalid credentials
- Broken SQL or API query logic
- Misconfigured transformation or mapping
Rejected rows
Identifies sync runs that contain rejected records due to schema mismatches, data validation failures, or destination-level constraints.
-
Default behavior: Alert if at least 1 row is rejected
-
Custom options: Alert only if rejections exceed a configured absolute count or relative percentage
-
Evaluation timing: Evaluated immediately after each sync run ends, regardless of whether the run completed successfully
-
Metric source: Sum of all rejected rows reported by the sync engine across all operation types (i.e., added, changed, or removed)
-
Logic: Compares rejected row count (or percentage of attempted rows) against user-defined thresholds. You can choose to measure:
- Absolute count of rejected rows OR
- Percentage of queried rows that were rejected
Model size
Monitors the number of rows returned by a sync’s source model query, which may indicate issues with upstream filters, joins, or warehouse state.
-
Default behavior: Alert if the model returns fewer than 1 row at sync runtime
-
Custom options: Configure a different minimum row count (e.g., alert if fewer than 1000 rows are returned)
-
Evaluation timing: Evaluated immediately after each sync run ends, regardless of whether the run was successful
-
Metric source: Raw row count returned by the model at sync run time
-
Logic: Compares returned row count against the configured lower bound. If the count is below threshold, a warning or critical status is triggered depending on severity configuration.
Sync duration
Tracks sync performance by measuring wall-clock runtime from start to finish.
-
Default behavior: Alert if runtime exceeds 60 minutes
-
Custom options: Set a duration threshold (in hours) between 1 and 24
-
Evaluation timing: Evaluated every 5 minutes; triggers as soon as duration exceeds threshold, even if the run is not complete
-
Metric source: Calculated as the time from when the sync was enqueued to the time it finished, or to now if the sync is still running
-
Logic: Evaluates total time spent across all sync phases— queued, querying, syncing, and writing logs— and compares against the configured duration threshold.
Successful operations (Throughput)
Detects stalled or idle syncs that are no longer pushing meaningful data to their destination.
-
Default behavior: Alert if fewer than 1 successful operation occurred in the last 7 days
-
Custom options: Customize the operation threshold and time window (e.g., alert if fewer than 50 ops in 24 hours)
-
Evaluation timing: Evaluated every 5 minutes; triggers as soon as duration exceeds threshold, even if the run is not complete
-
Metric source: Aggregated sum of successfully added, changed, and removed rows across all sync runs within the time window
-
Logic: Compares the total number of successful operations in the time window against the configured threshold.
Muting triggers
You can mute individual alert triggers for a sync to temporarily suppress notifications.
- Muting prevents notifications, but the sync's alert status still updates in the UI
- You can mute for a specific duration (e.g., 1 hour, 1 day) or indefinitely
- Muting is helpful during planned maintenance, known issues, or when you need quiet hours
To mute a trigger, click the "Mute..." link at the top of the alert on the sync page, or:
- Go to the sync’s Alerting tab
- Click the volume button on the trigger
- Select a mute duration from the options
Muted triggers still appear in rollups and dashboards—but without triggering notifications to your team.
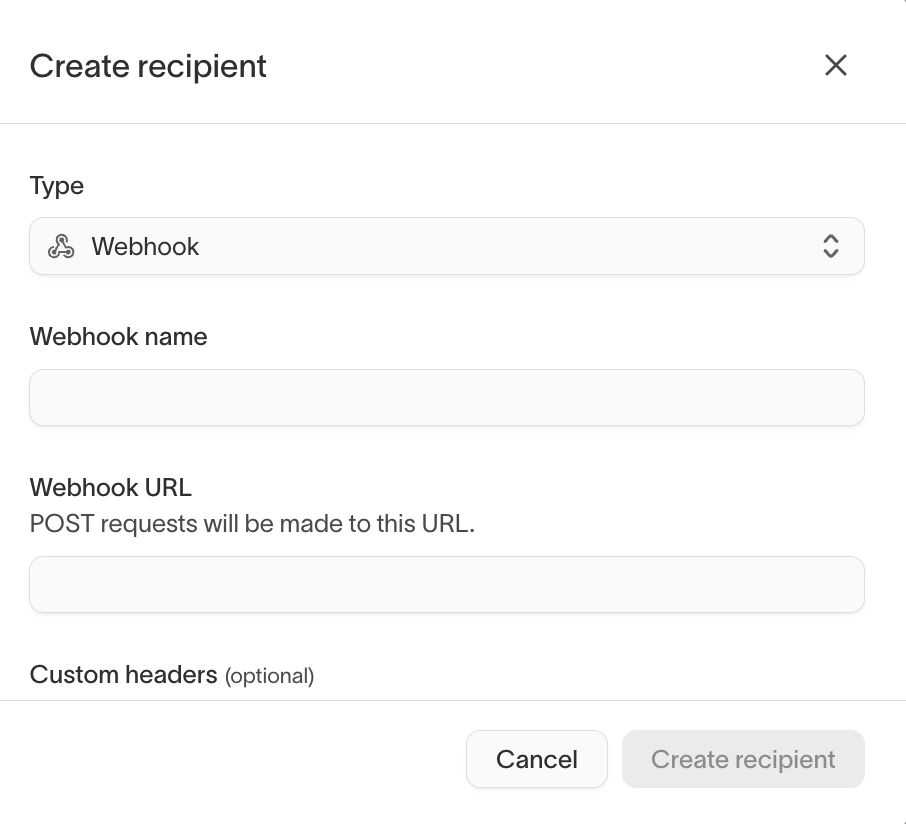
Webhook alert channels
In addition to email, Slack, SMS, and PagerDuty, you can send alert notifications to a webhook endpoint. Webhooks deliver a JSON payload to a URL you specify whenever an alert fires or recovers.
Custom headers
Webhook alert channels support custom HTTP headers. Use custom headers to include authentication tokens, routing keys, or other metadata your endpoint requires (for example, Authorization: Bearer <token> or X-Routing-Key: ops-team).
Custom headers are sent with every webhook request for that alert channel.