| Audience | Marketers and analytics/data engineers |
| Prerequisites | A configured schema. Open an existing audience or start a new one. |
Understand how to use Insights in Customer Studio to explore metrics, analyze trends, and power downstream targeting and enrichment workflows.
What Insights shows
Understand and validate the size, composition, and characteristics of your audience using Insights. While defining or editing an audience in Customer Studio, you can view summary metrics, compare overlaps, and break down key traits inside the visual builder.
Insights analyzes a single audience while you build it: who's in it right now, how it's composed, and how it overlaps with other audiences. To watch an audience change after it's live, use its overview. For analysis that spans campaigns, use Intelligence, a separate product with charts, metrics, funnels, and experiments, built on the same customer data.
Access audience insights
You can access insights while creating or editing an audience in two places:
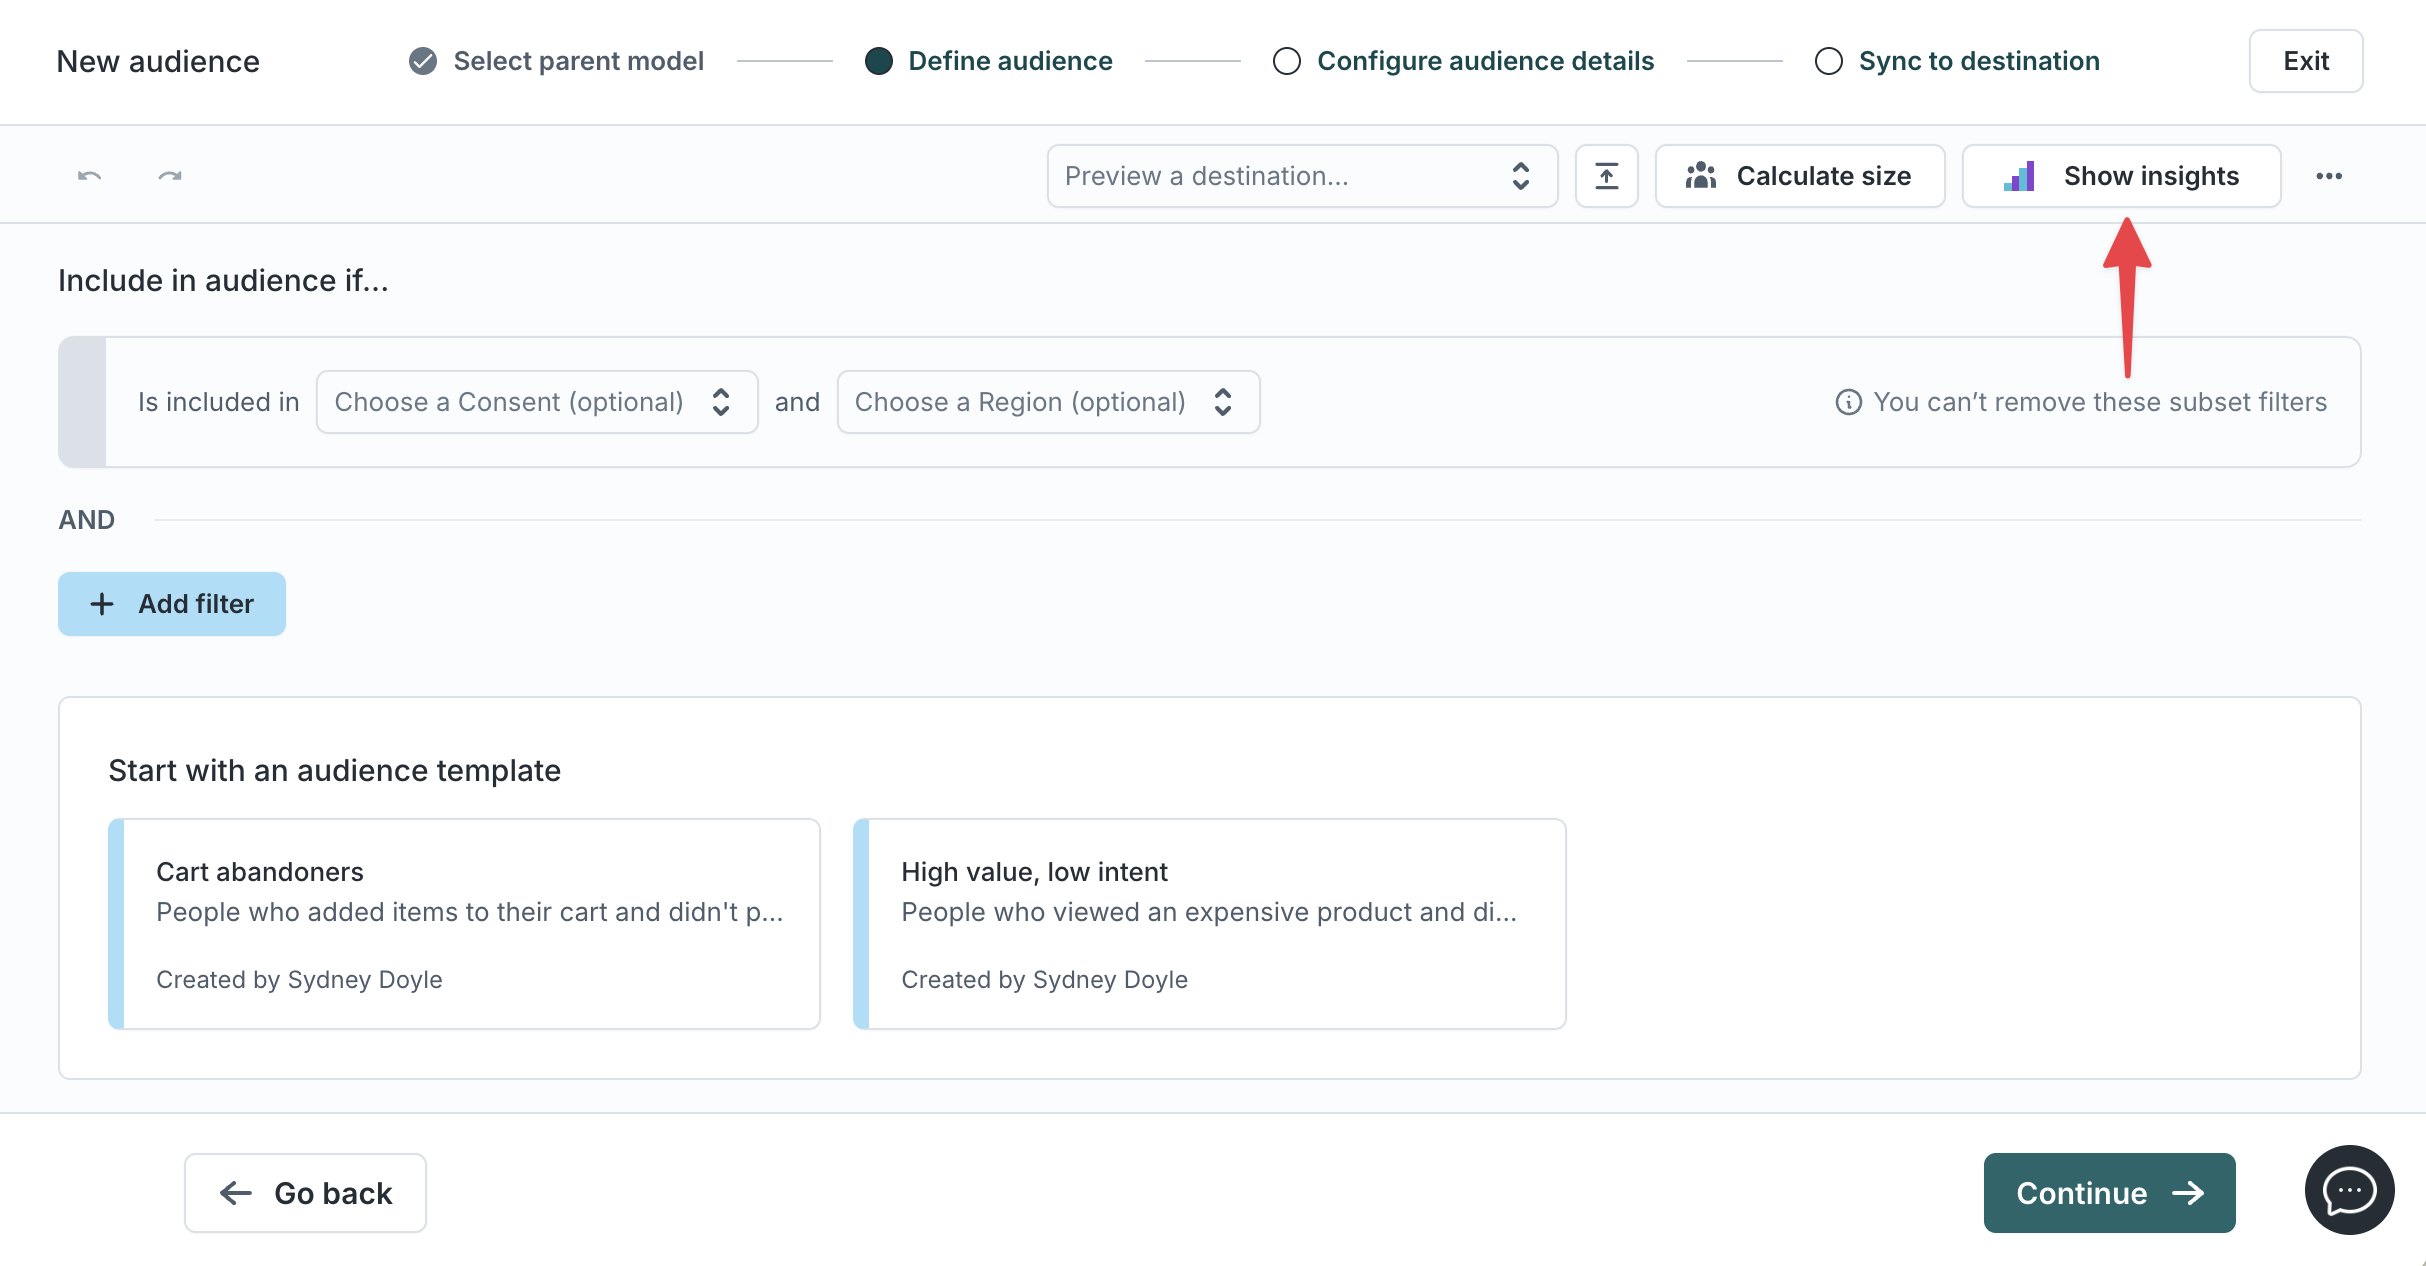
- In the audience creation flow, during the Define audience step
- In the audience builder, under the Definition tab
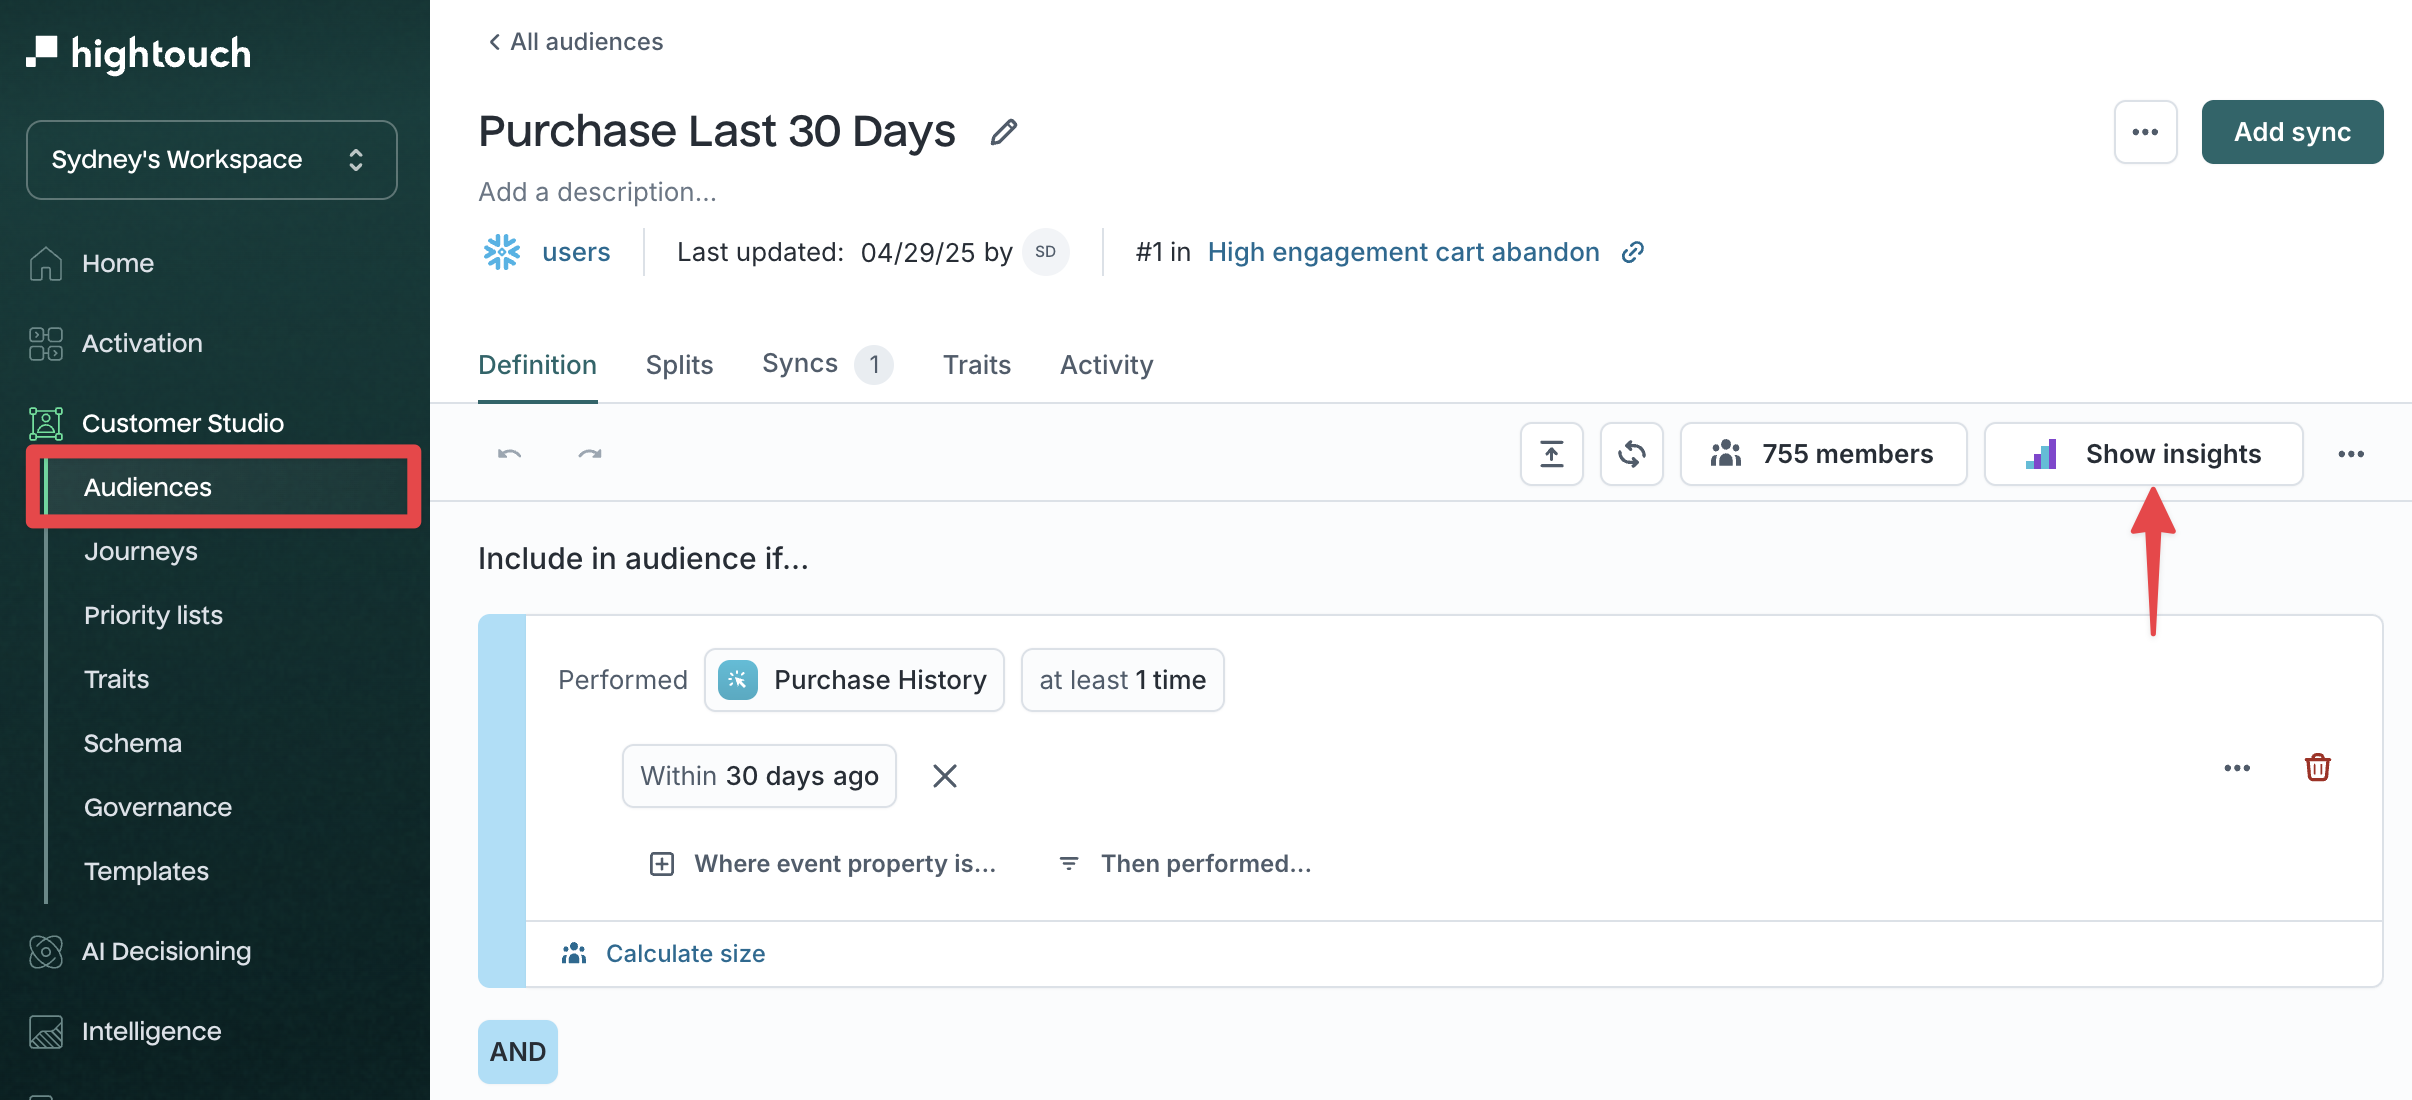
In either place, select Insights in the filter builder toolbar to open the panel.
Calculate audience size
For the overall audience count and a spot-check of members, use Build an audience. Insights adds size views the top-level count doesn't show.
Calculate the size of a specific filter group by selecting Calculate size within any top-level AND block. This shows how each filter group contributes to or reduces overall audience membership.
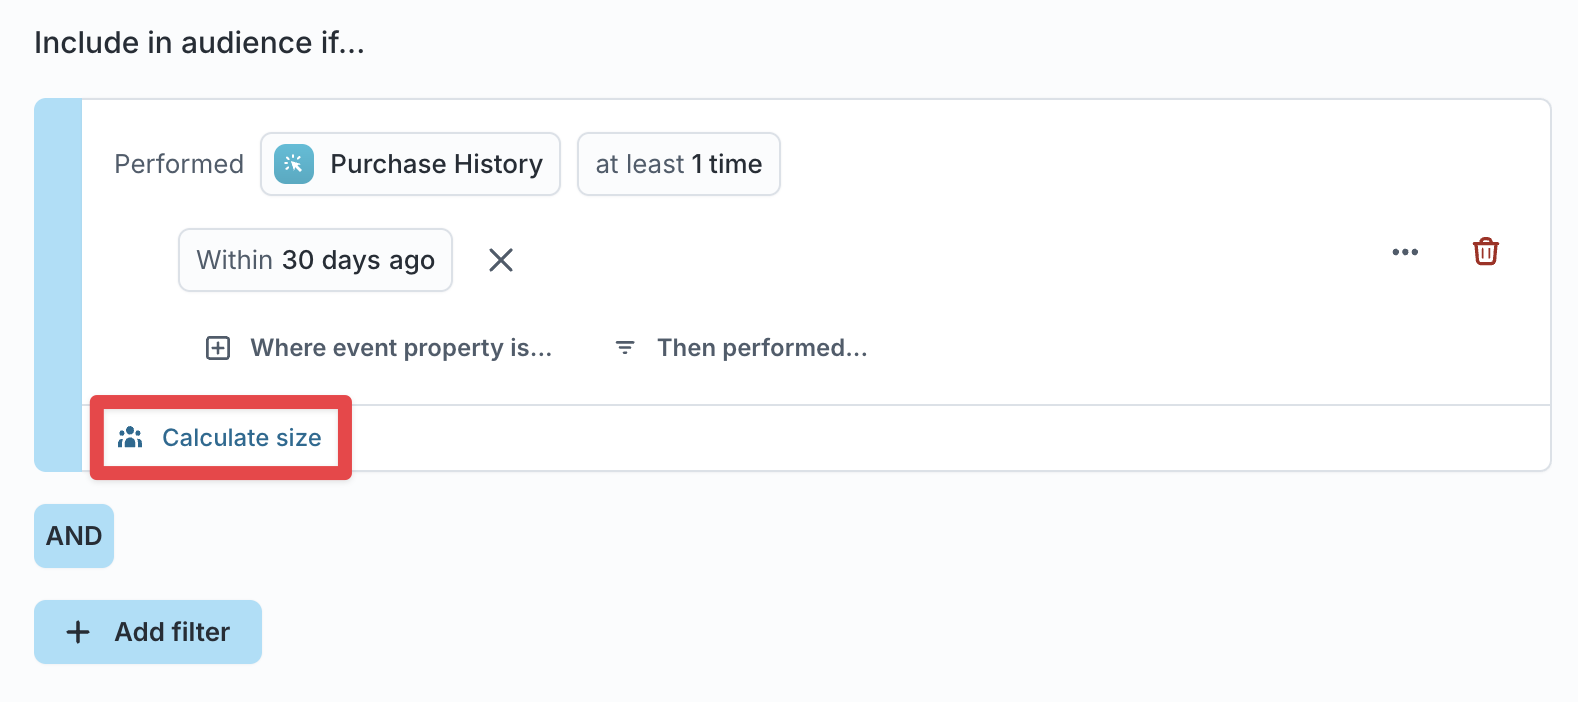
When schema labeling is enabled for a People ↔ Household or People ↔ Account relationship, you can view the size of both models. For example, if your audience is based on a People model, you can also see how many Households or Accounts contain at least one person matching your filters.

If sampling is enabled on your data models, preview results in the audience builder may be returned using sampled data for faster performance. Learn more about sampling.
Member preview
Click the size preview count to more closely inspect the list of members who currently meet your audience criteria and ensure you're building the correct audience. If you've chosen to redact any columns in your model configuration, they are redacted here.
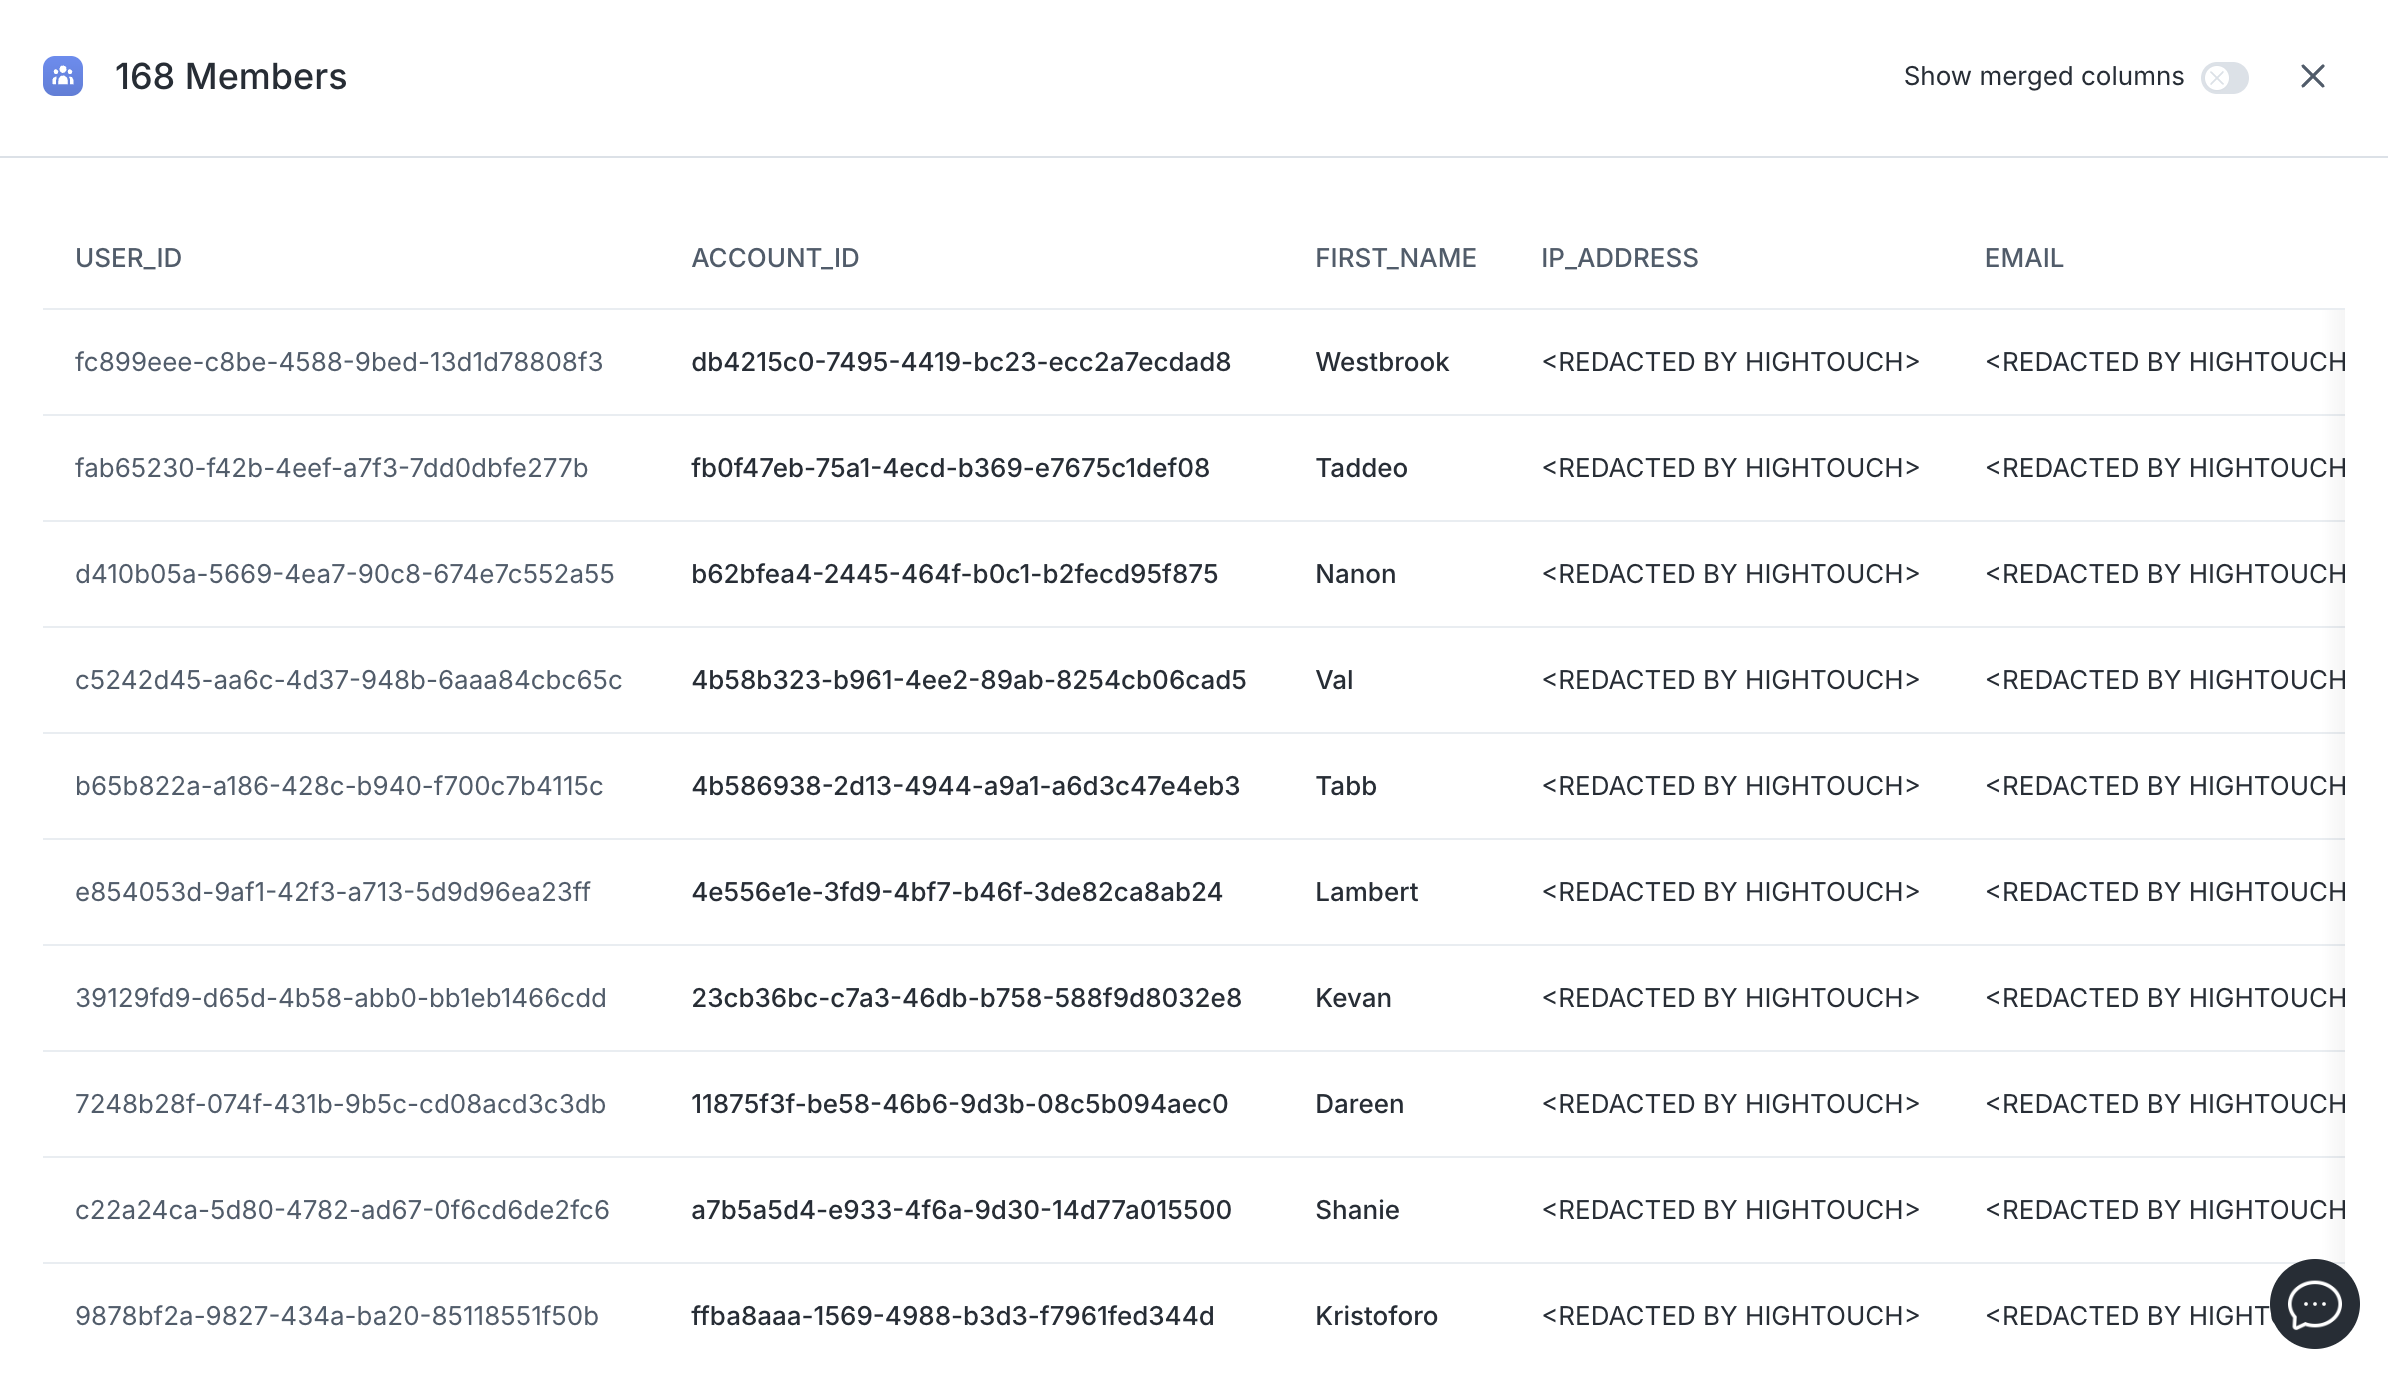
Clicking on a particular member will open the member details panel to give you an even deeper look at your audience members.
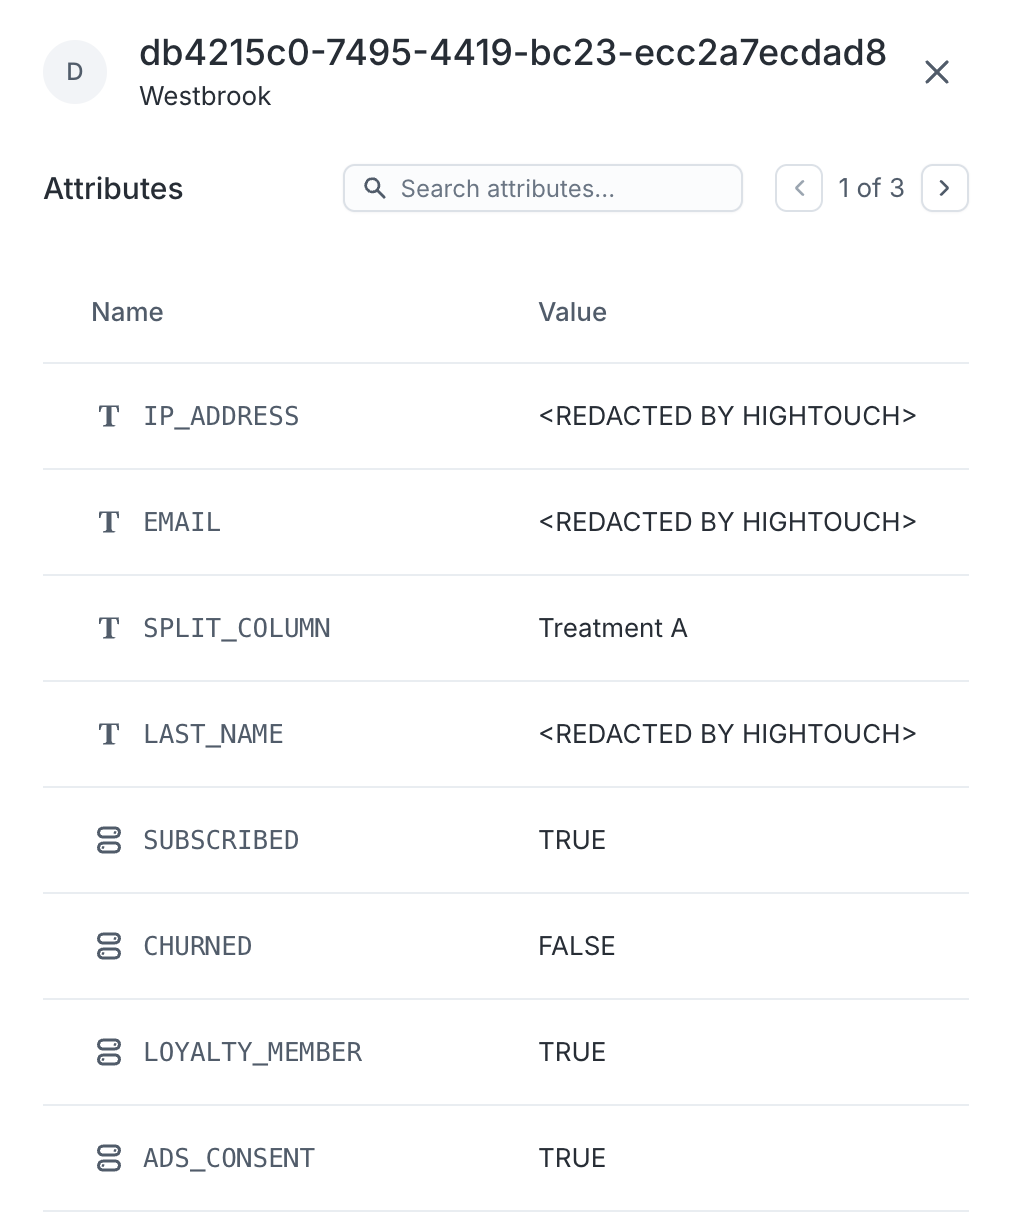
When schema labeling is enabled for a People ↔ Household or People ↔ Account relationship, you can view details for both models and see the membership between them. For example, if your audience is based on a People model, you can view the Households or Accounts that contain at least one person matching your filters. Within each person, you can see which households or accounts they belong to, and vice versa.
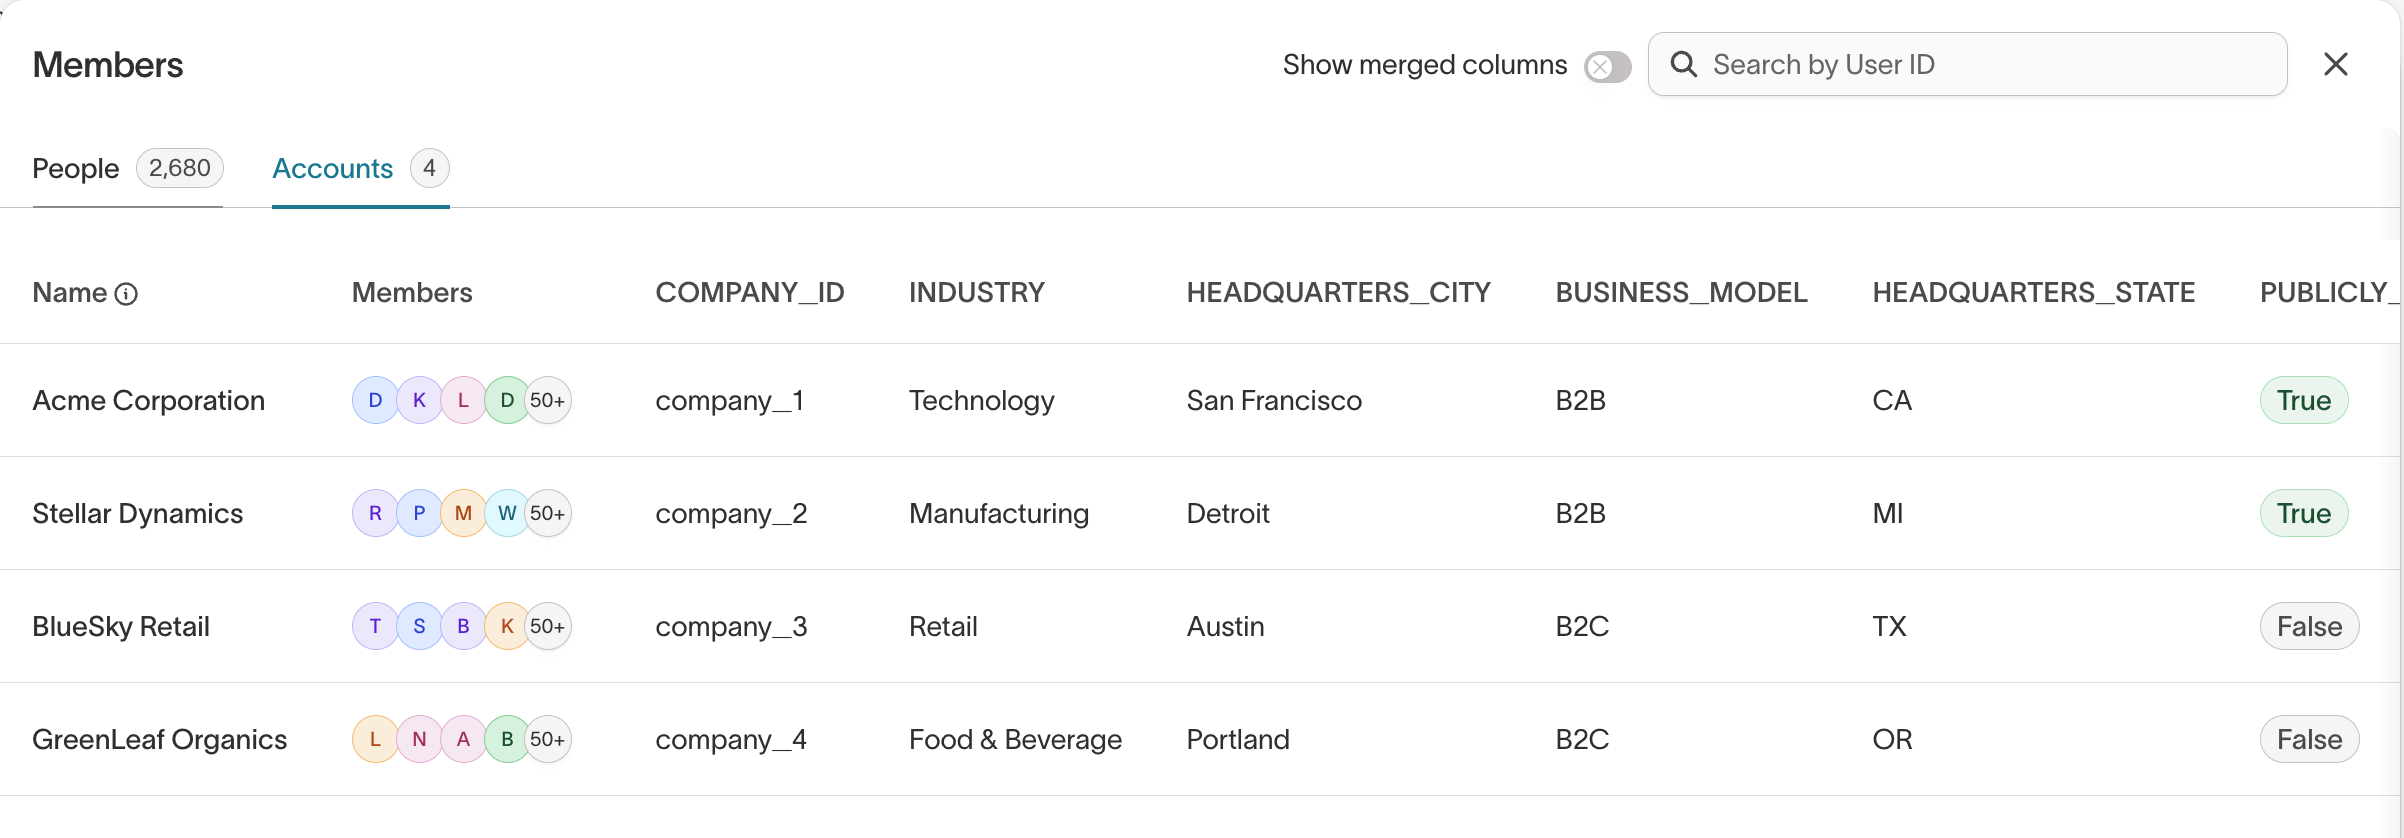
To look up and inspect members without building an audience first, use Profiles.
Audience overlaps
Audience Overlaps can only be set up between audiences that use the same parent model.
With many audiences syncing simultaneously, it can be difficult to ensure that end users aren't being targeted by multiple campaigns.
Audience overlaps help you validate the composition of your audiences by letting you compare one audience against another. You can find audience overlaps within the Insights panel when defining your audience.
Select a previously created audience from the dropdown to compare the audiences.
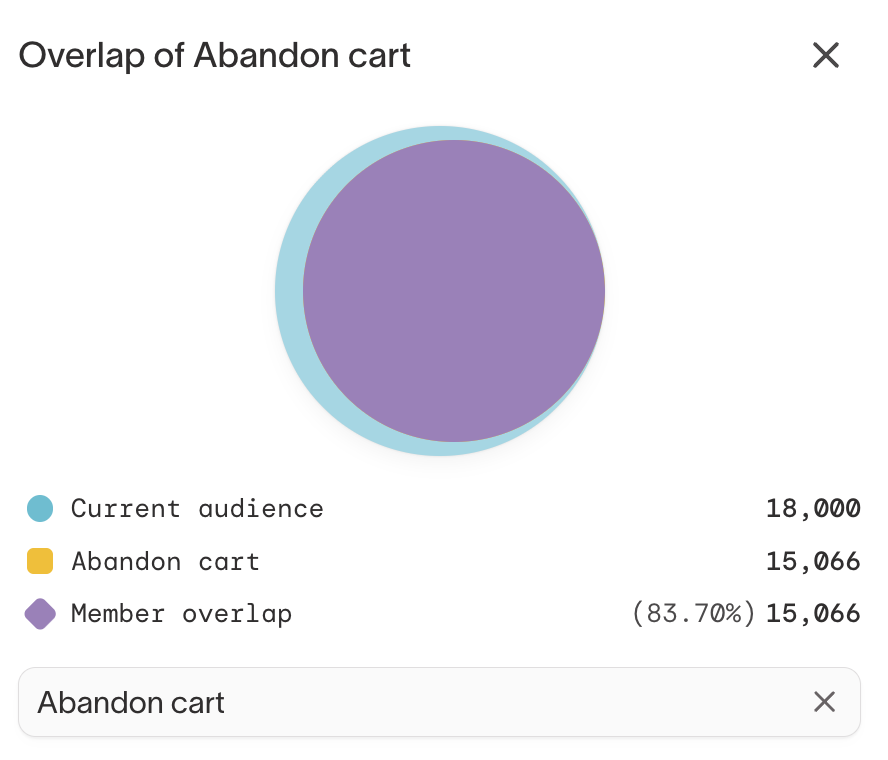
For more information, check out the Audience Overlaps blog post.
Audience breakdowns
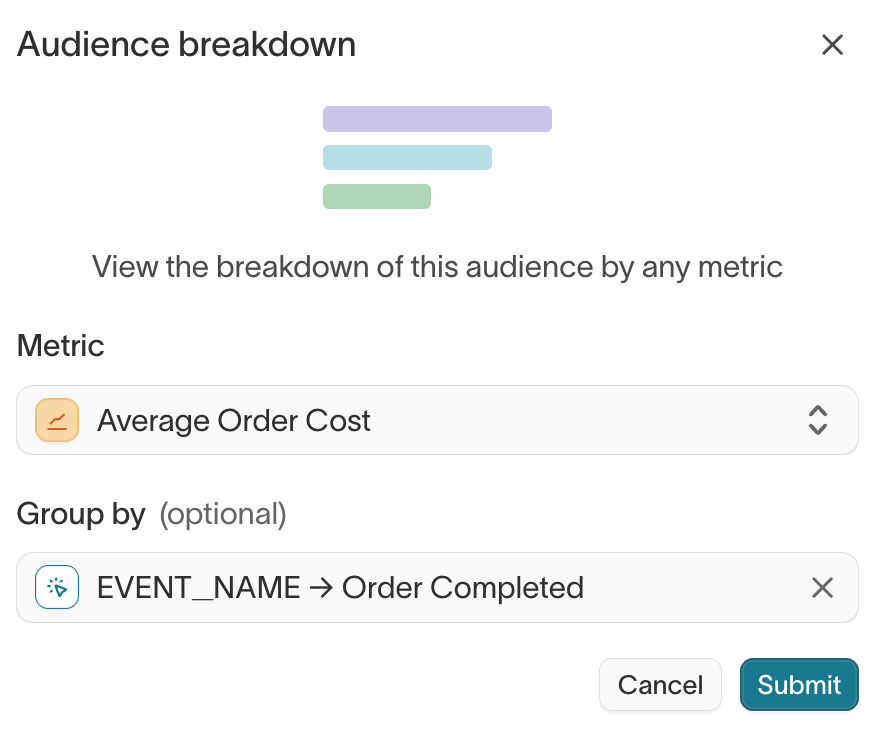
Breakdowns help quickly check your audience segmentation and ensure the audience meets your needs by enabling you to better understand the distribution of specific characteristics within audiences.
Breakdowns help you explore how an audience is distributed across key traits or metrics—for example, how many users fall into each region, loyalty tier, or spending bucket.
To create a breakdown:
- Open the Insights panel.
- Go to the Breakdowns tab.
- Choose a metric or property, such as:
- Saved metrics (custom metrics from your workspace)
- Events (e.g., Bookings)
- Relations (e.g., Preferred Hotel)
- Properties (e.g., Region, Language)
- Traits (custom trait columns)
You can also group by a user property (e.g., group Total Bookings by Region) and choose an aggregation type (e.g., count, average).
Breakdowns are shown as charts within the panel, helping you visually validate whether your audience reflects your desired segmentation.
Numerical metrics
When you select a numerical property or a model-based metric (e.g. events), you can optionally select a non-numerical user property to group the metric by.
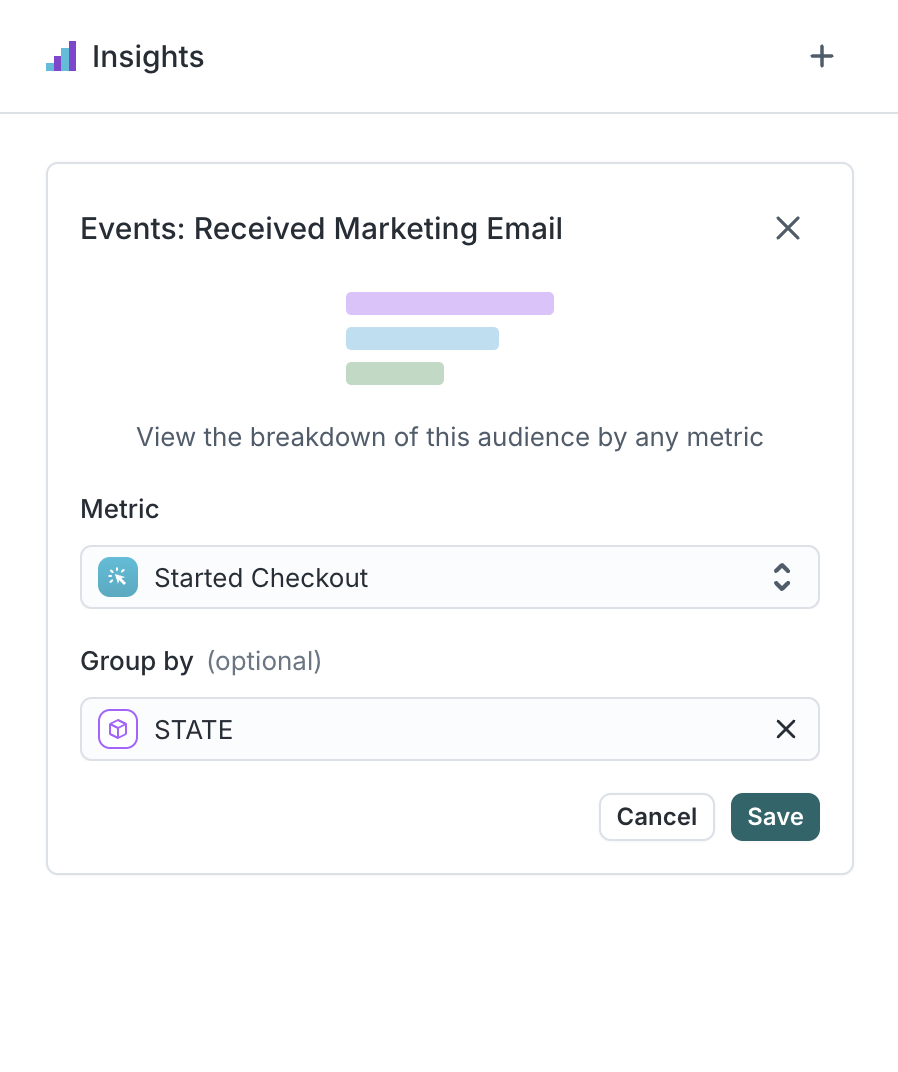 | 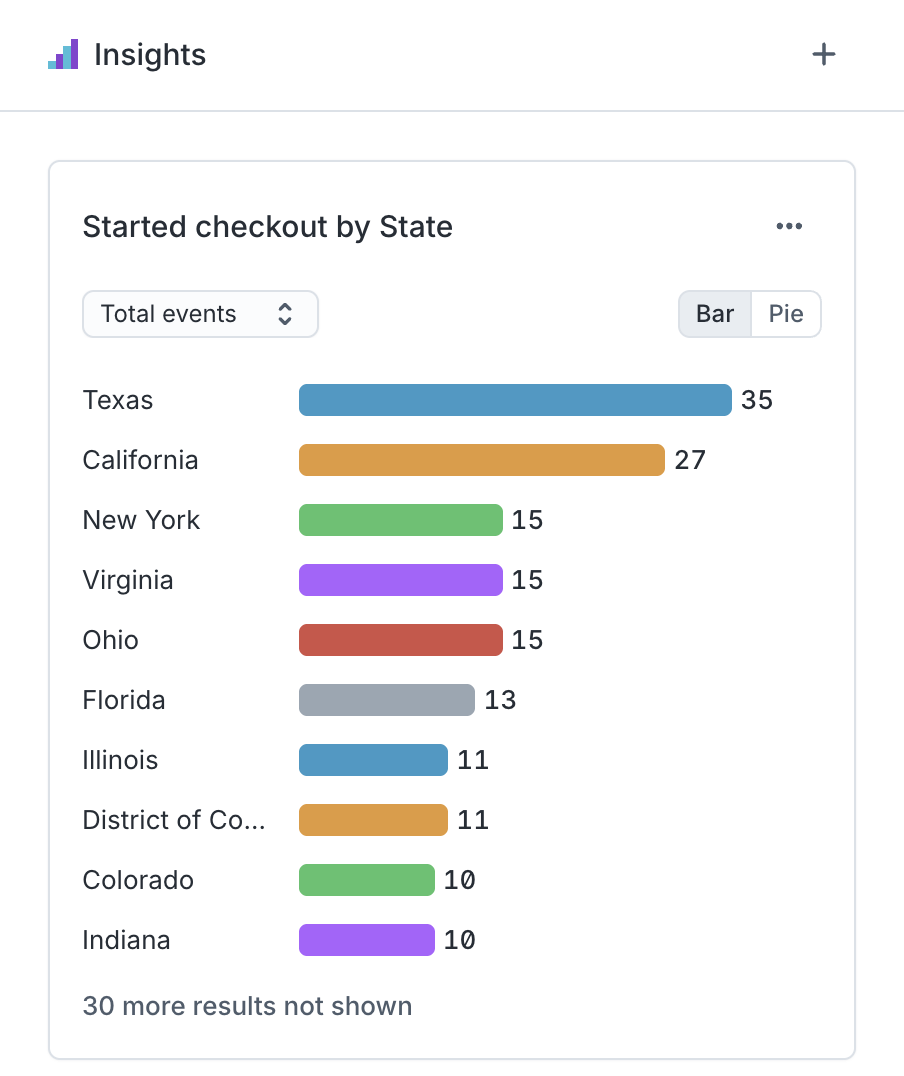 |
|---|
Except in the case of Saved metrics, if no Group by option is selected, the chart will group by the metric itself.
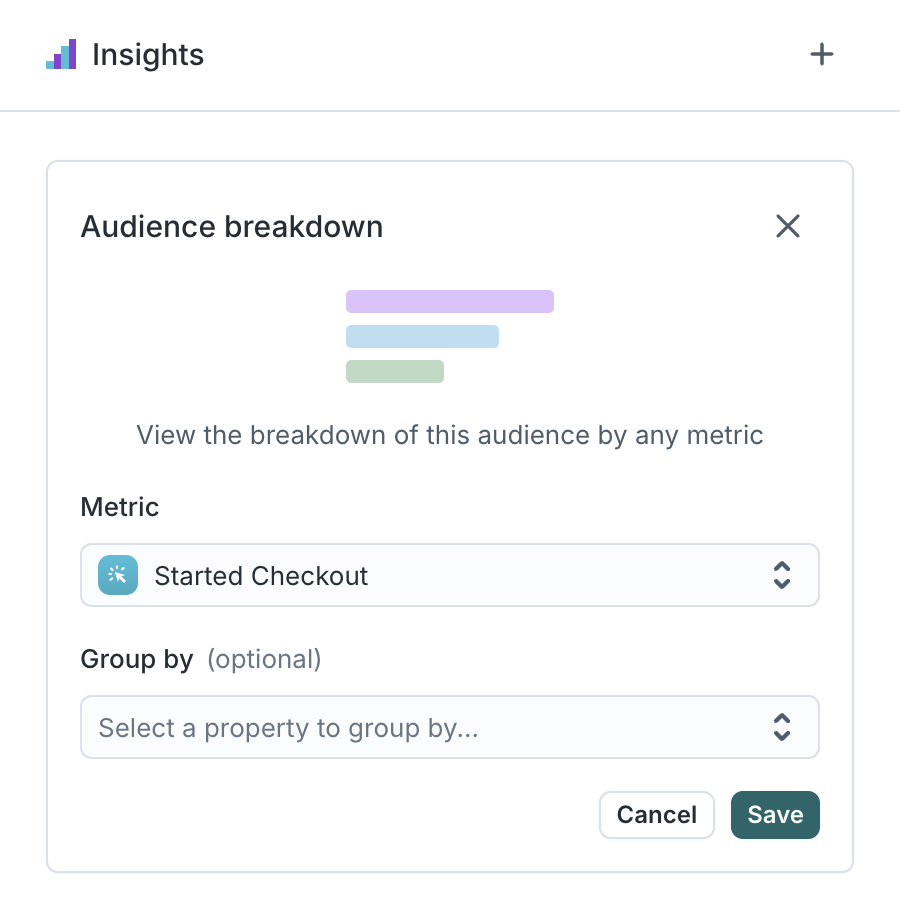 | 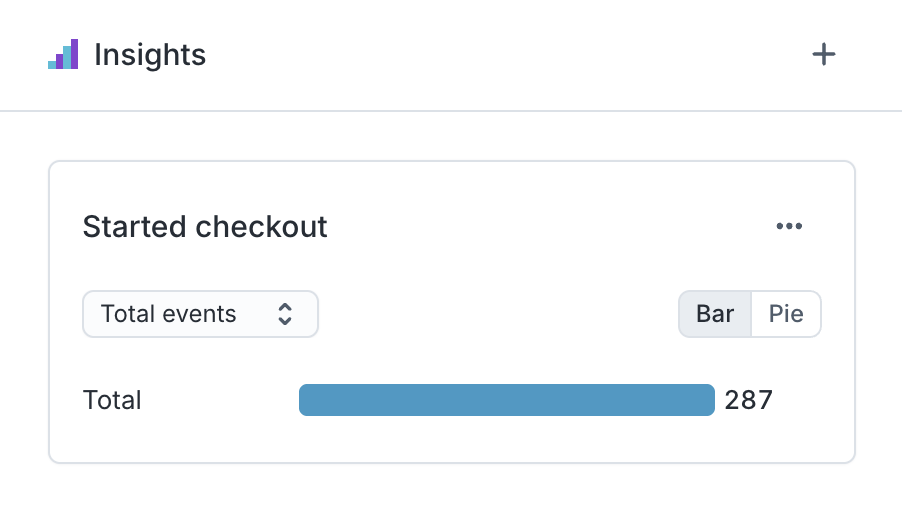 |
|---|
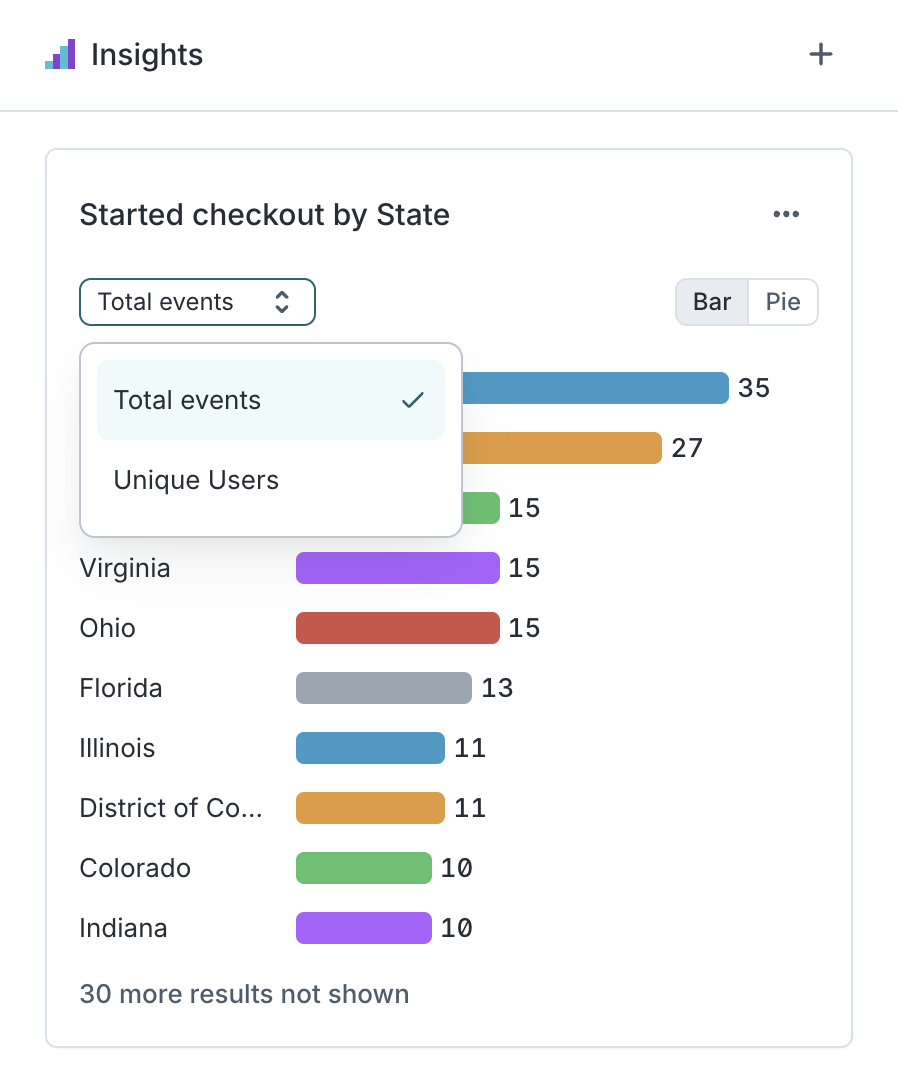
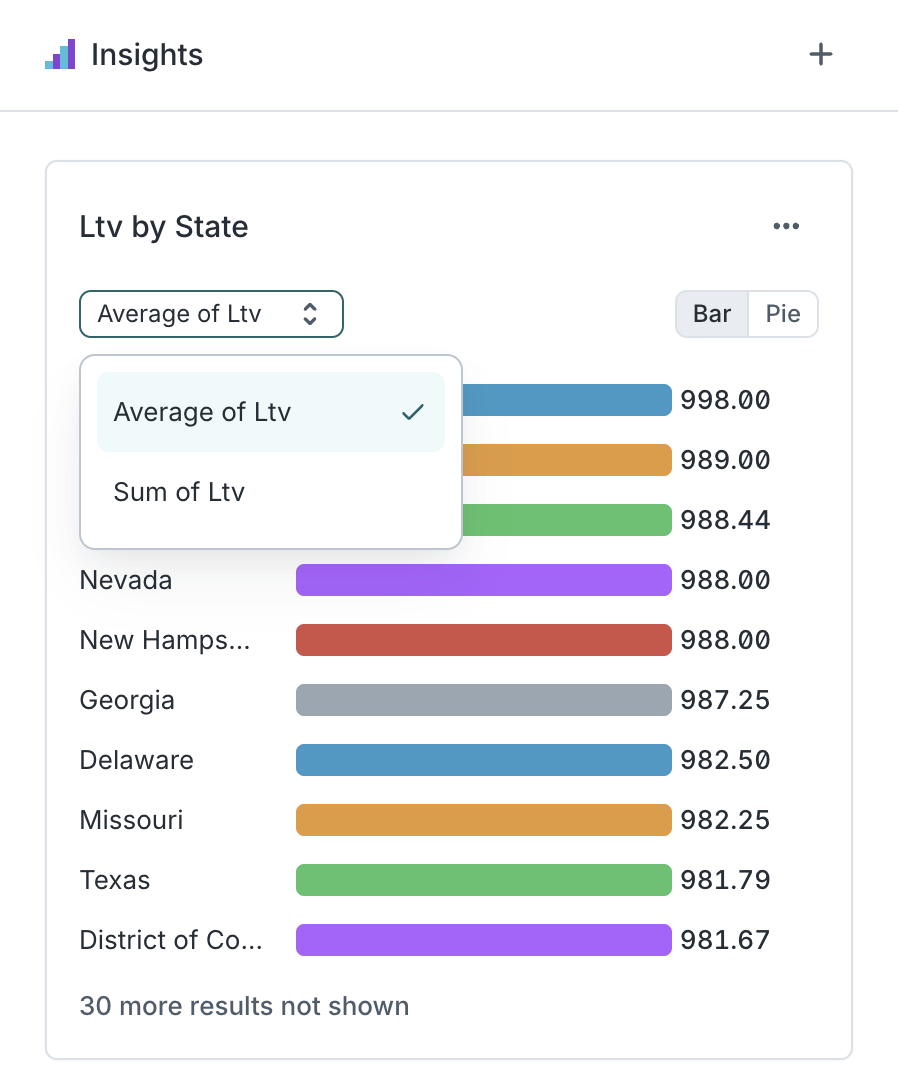
Depending on the type of numerical metric you select, you are able to choose additional options on what to view in your breakdown.
 |  |
|---|
Further exploration
To explore a breakdown in more depth, you can open it in Charts to apply additional filters and groupings, explore different visualizations, and save the chart for future reference.
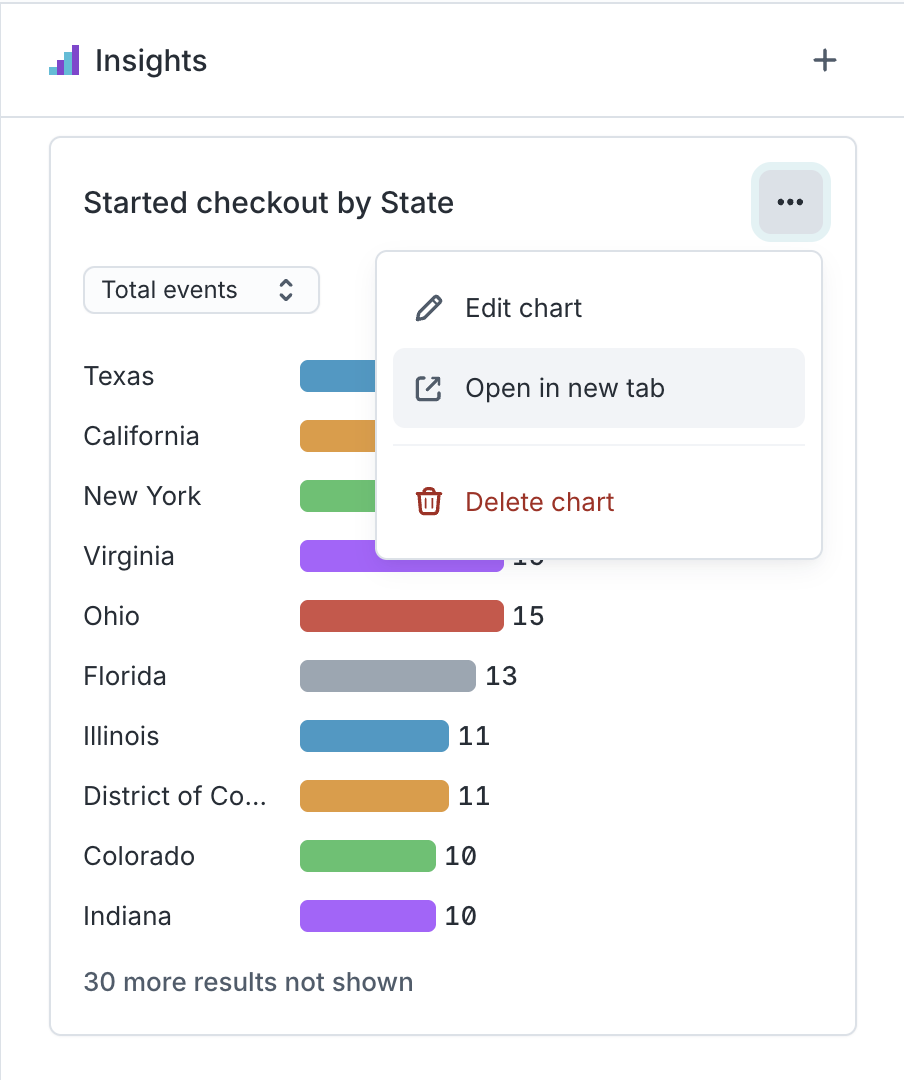
For more information, check out the Audience Breakdowns blog post.
FAQ
Is our insight data saved by Hightouch?
No, Hightouch never saves your data.
Do Breakdowns and Overlaps reflect if an audience belongs to a priority list?
Yes-the insight tools take audience priority into account.