| Audience | Marketers, data teams |
| Prerequisites |
|
The Health tab gives you real-time visibility into your agent's pipeline runs, channel delivery rates, and the freshness of the outcome data powering optimization.
What you'll learn
After reading this article, you'll know how to:
- Monitor message generation runs
- Diagnose pipeline failures
- Track channel delivery success rates
- Troubleshoot low delivery rates
- Check outcome data freshness
Overview
The Health tab provides operational visibility into your agent from a single view. No additional setup is required — the tab automatically pulls data from your existing agent configuration, runs, and event models.
To access it, open an agent and go to the Health tab.
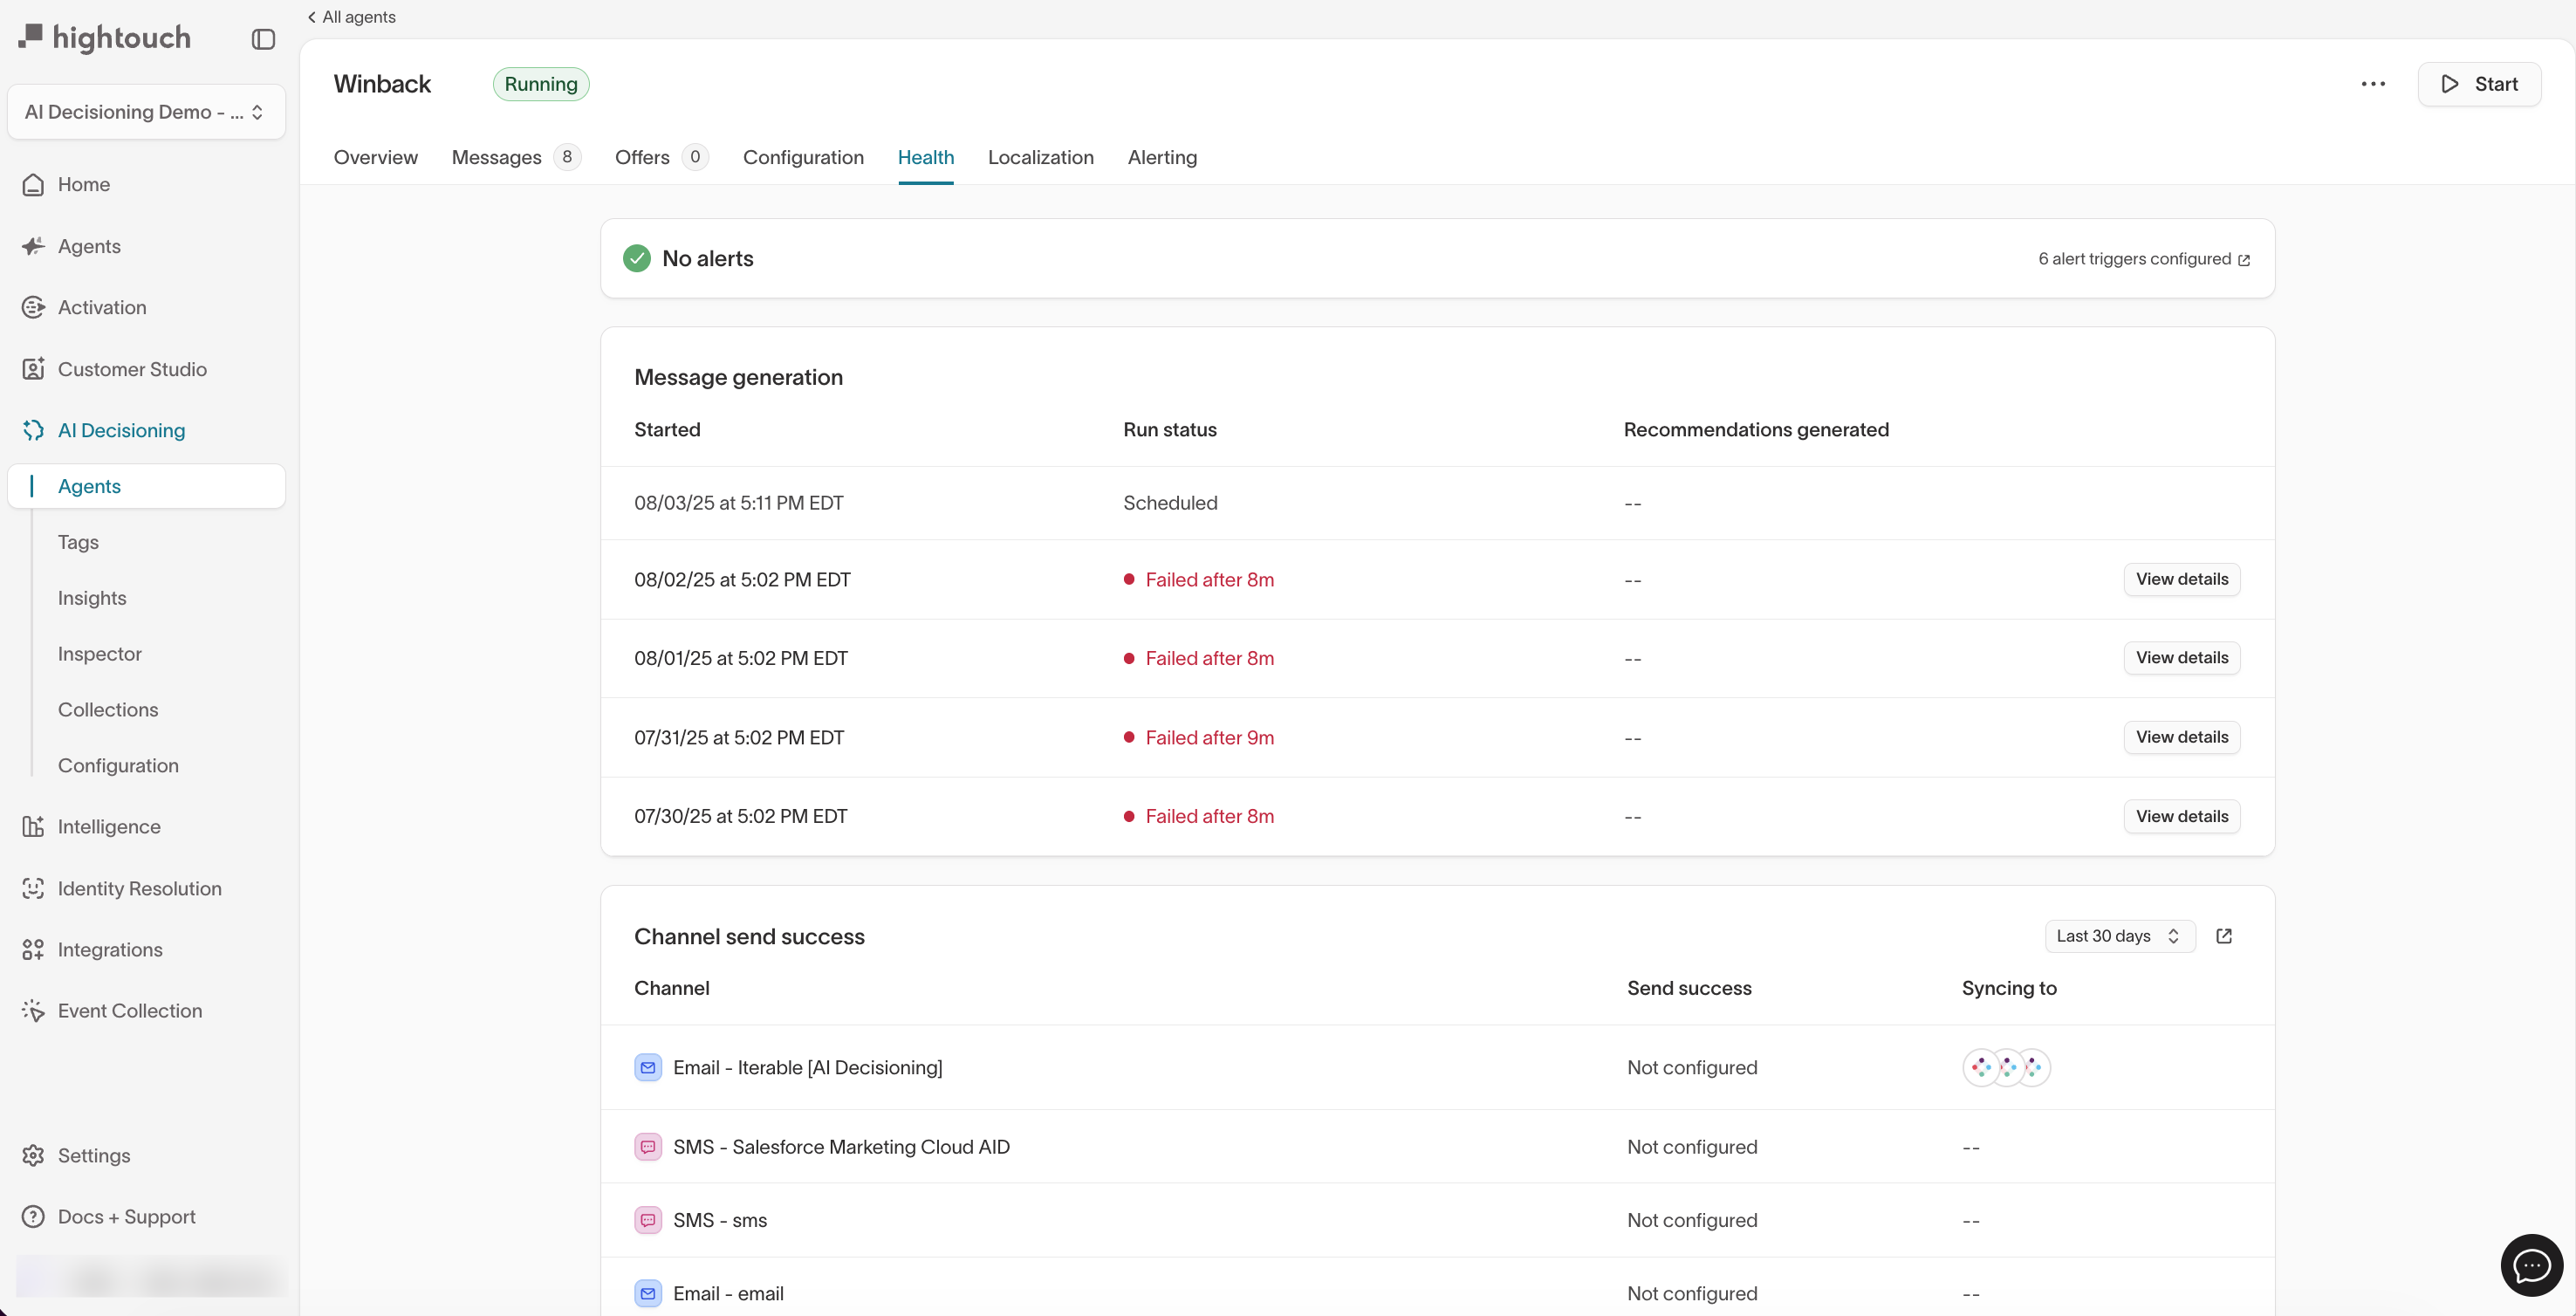
Message generation
The Message generation section shows the current and historical state of your agent's daily runs — the runs that schedule and produce AID messages.
Current run: If a generation is in progress, you can see when it started, how long it has been running, and its current pipeline step.
Last run: Shows when the most recent generation completed, how long it took, and how many recommendations were produced.
Historical runs: A table of recent runs with start time, duration, run status, and recommendation count.
Failed runs: If a run encountered an error, it is flagged in red. Click View details to see per-stage durations and actionable error messages.
View details
Click View details on any run to open a per-stage pipeline breakdown. This view is useful for diagnosing run failures, identifying bottlenecks, and understanding where time is spent across the generation process.
Each run includes the following pipeline phases:
- Cache Interactions — Loads recent interaction data
- Assign User Groups — Assigns users to treatment or holdout groups
- Pull Warehouse — Retrieves data from your warehouse
- Generate Interactions — Produces message recommendations for eligible users
- Write Warehouse — Writes results back to your warehouse
- Compact Interactions — Cleans up interaction records
- Trigger Analytics — Updates reporting and analytics data
Each phase shows its duration and status (Completed, Pending, or Failed). Stages that haven't started yet show as Pending.
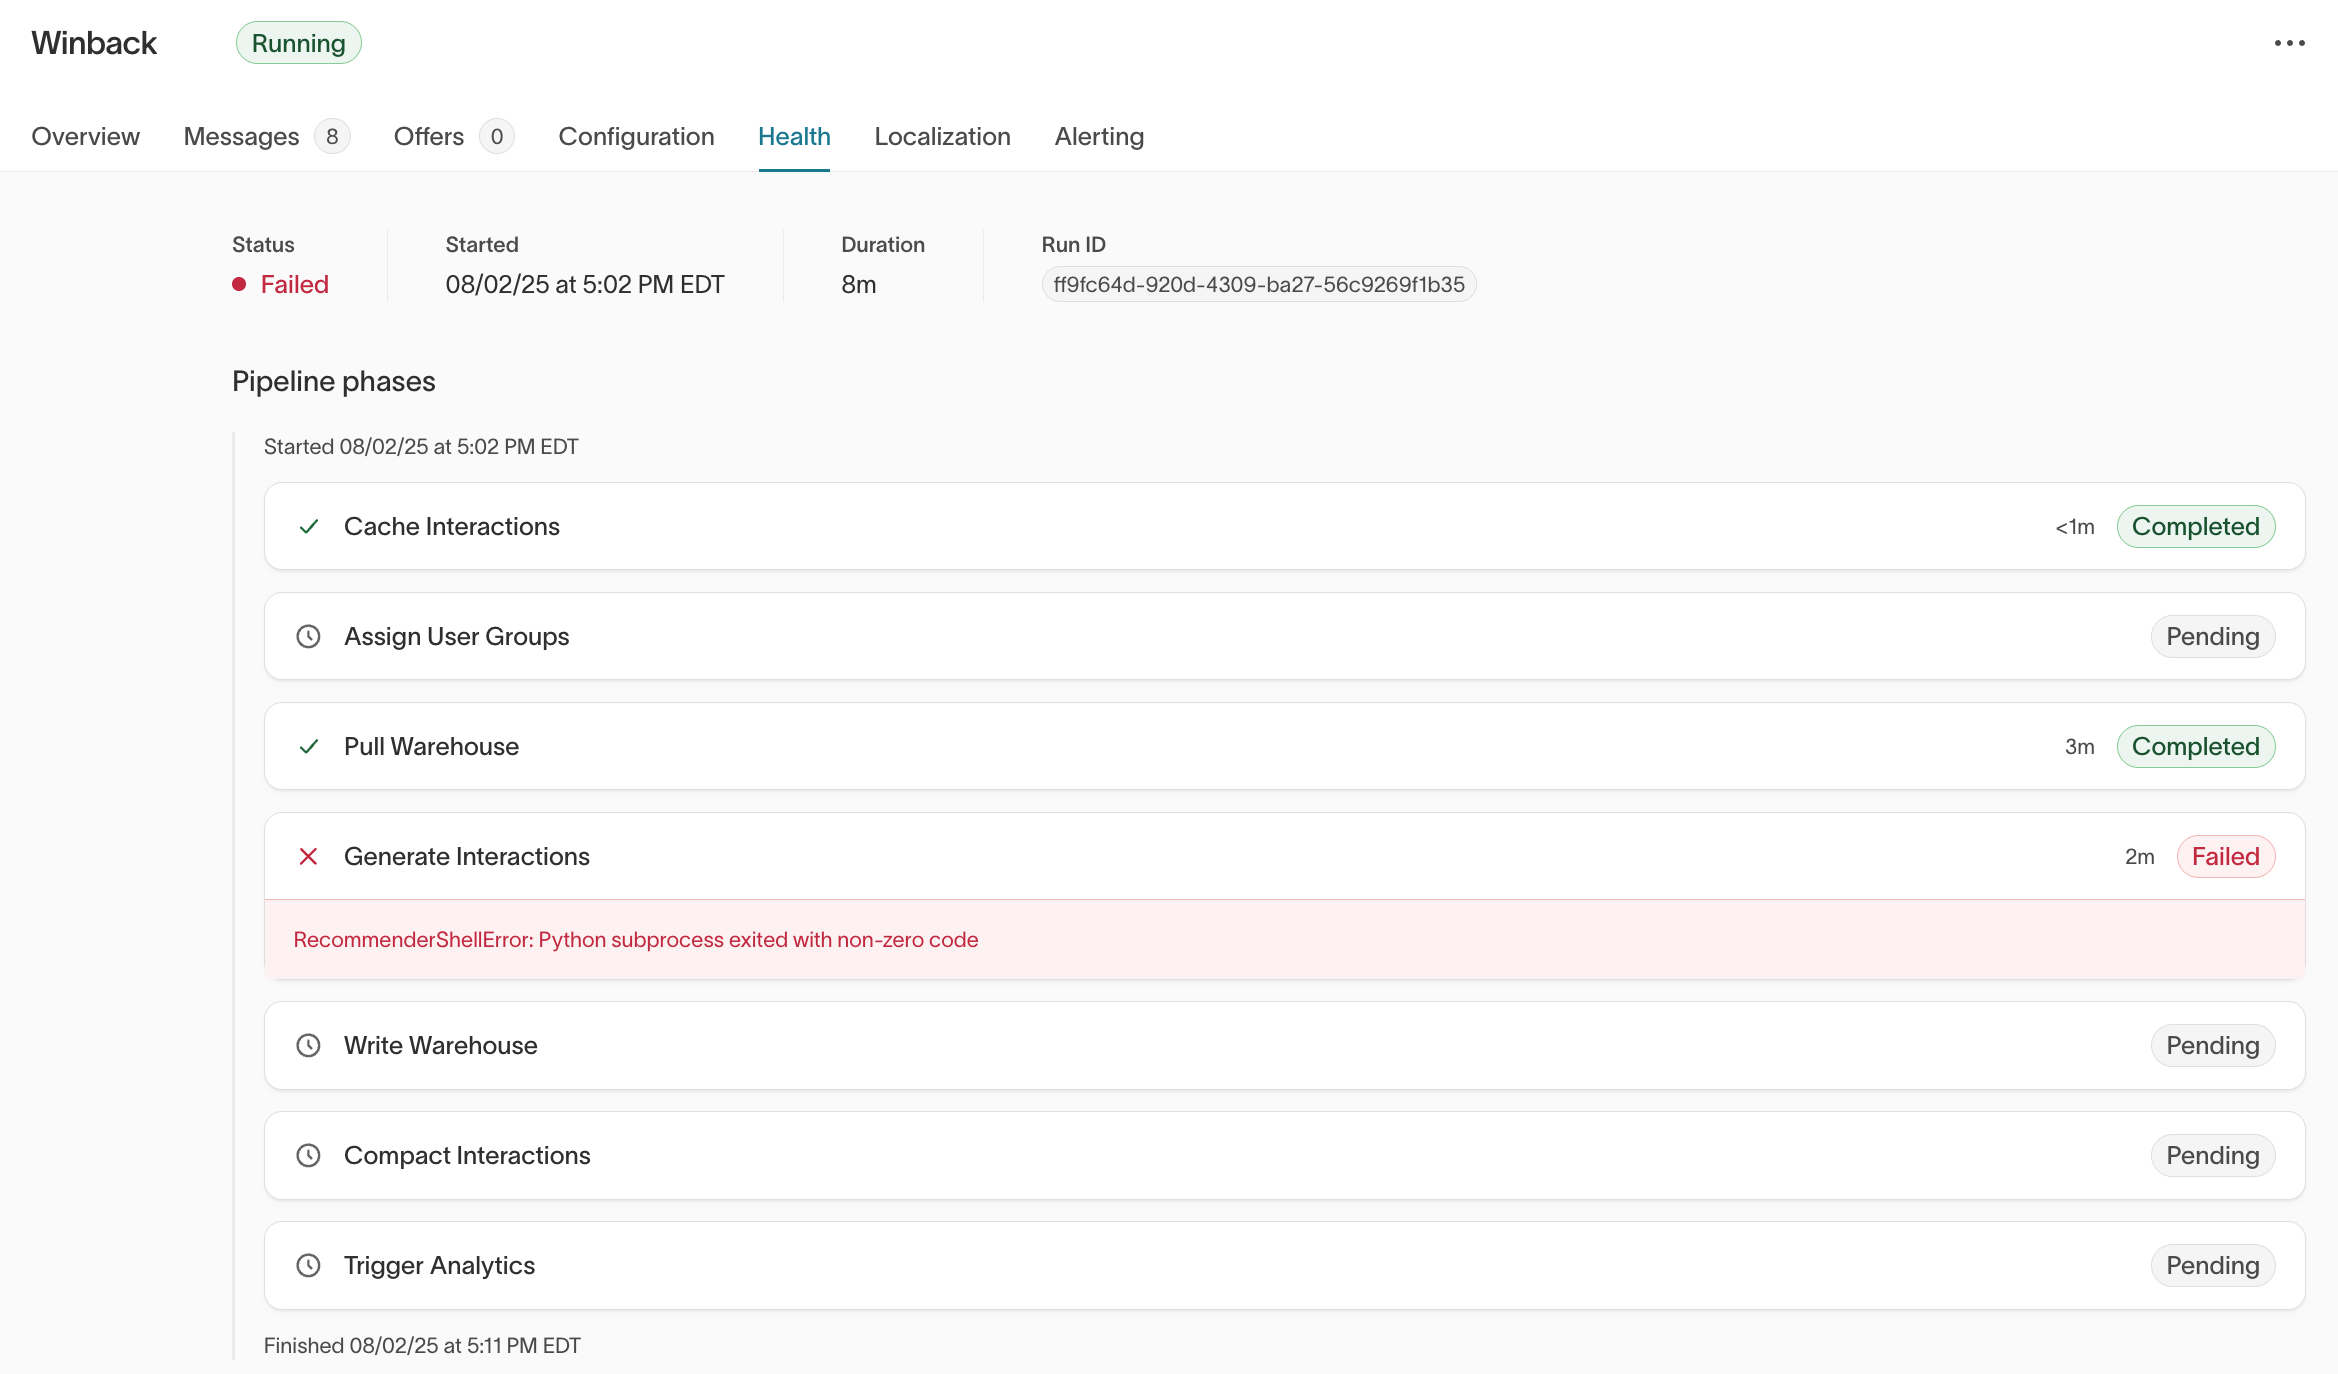
When a run fails, the error message includes guidance on what went wrong and what you can do to fix it. Errors fall into two categories:
- External issues (actionable by you): Problems originating from your data or configuration. For example, a column may have been dropped or renamed in your warehouse while your parent model, user feature matrix, audience, or event goals still reference it. Update the affected configuration and re-run the agent.
- Internal issues: Problems on Hightouch's side. Hightouch receives internal alerting for all agent run failures and proactively investigates. You can also reach out to your Hightouch contact for support.
If a run fails at Pull Warehouse, check that your data warehouse is running and accessible, and verify that your connection credentials in Hightouch are correct.
A common cause of run failures is a column being dropped or renamed in your warehouse while your audience, feature matrix, event models, or parent model still reference it. If you see a missing column error, check each of those configurations for stale references, update them to reflect the current schema, and re-run the agent.
Channel send success
The Channel send success section shows how successfully your agent's messages are being delivered to users, broken down by channel (Email, SMS, Push, and others).
- Delivery success rate: The percentage of scheduled messages confirmed sent by your ESP, based on the send event model configured for each channel.
- Raw counts on hover: Hover over the percentage to see exact sent versus scheduled message counts (for example, "34,189,852 sent / 36,293,161 scheduled").
- Destination: Shows which integration destination is handling delivery for that channel.
- Time filter: Use the dropdown in the top-right corner to filter delivery success by All time, Last 7 days, Last 30 days, or Last 90 days.
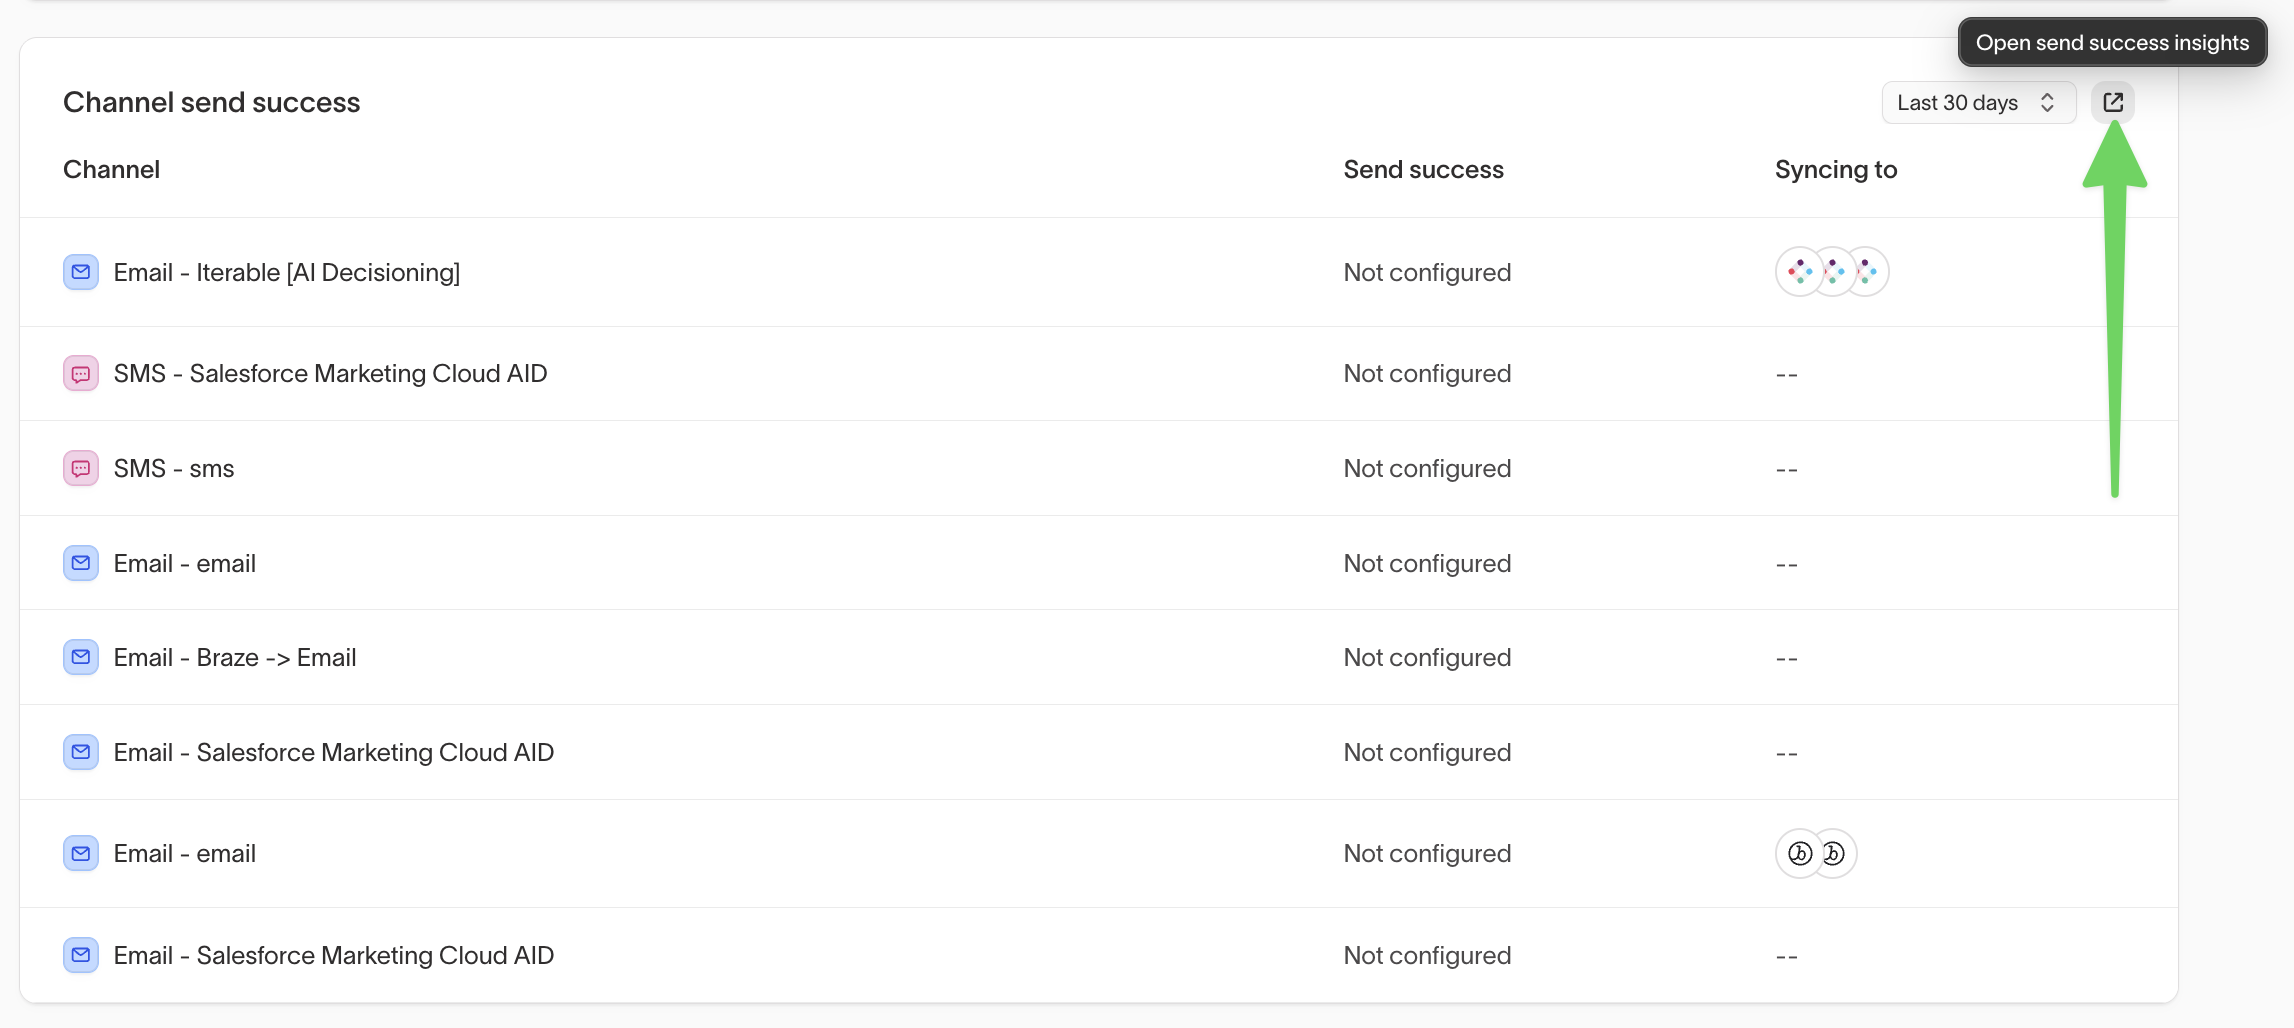
If send success is not configured for a channel, click Open send success insights or go to Insights → Send success to configure it.
Send success tracking requires send events to be linked to your channels. See Send event tracking for setup instructions.
Troubleshoot low delivery rates
If you see unexpected delivery numbers, here are the most common causes:
- 0% with a warning ("Send event model may not be set up correctly"): The send event model for that channel likely needs to be reviewed. Confirm that the event model tracking send confirmations from your ESP is correctly configured and scoped to the relevant business units or campaign identifiers for your AID campaigns.
- Below 50% (highlighted in red): This threshold flags channels that may have a misconfigured event model or a delivery issue worth investigating. This is particularly common during initial setup, when send tracking is first being validated.
Outcome health
The Outcome health section tracks the freshness of the event data powering each of your agent's configured outcomes (goals). This helps you catch reverse ETL pipeline issues before they affect agent optimization.
- Recent timestamp: Outcome event data is flowing correctly.
- Stale or missing timestamp ("--"): Event data has not been loaded recently. Investigate whether the reverse ETL pipeline feeding that outcome has stalled or broken.
Each outcome's "Last data loaded" timestamp reflects when event data was most recently ingested, not when the agent last ran. If you see a stale timestamp, check your reverse ETL sync for that outcome before the next agent run.
Troubleshooting
| Issue | Likely cause | Resolution |
|---|---|---|
| Channel send success shows 0% with a warning | The send event model for that channel is not configured correctly. | Confirm the event model tracking send confirmations from your ESP is correctly configured and scoped to the relevant business units or campaign identifiers for your AID campaigns. |
| Outcome health shows a stale or missing timestamp | The reverse ETL pipeline feeding that outcome has stalled or broken. | Check the reverse ETL sync for the affected outcome and resolve any pipeline issues before the next agent run. |
| Pipeline run fails at Pull Warehouse | Your data warehouse is unreachable or credentials are invalid. | Verify that your warehouse is running and accessible, and confirm your connection credentials in Hightouch are correct. |
| Pipeline run fails with a missing column error | A column was dropped or renamed in your warehouse while your parent model, audience, feature matrix, or event models still reference it. | Update the affected configurations to reflect the current schema, then re-run the agent. |