We’re entering a time when collecting data has become easy. It often doesn’t matter the number of data sources you have or where you want to put data; some tools can make the whole process easy.
One practice that this new era enables is the “composable CDP.” A composable CDP involves collecting customer data from sources, cleaning it and storing it in a central location, and then taking action on it, all with best-of-breed toolings such as Fivetran, Snowflake, and Hightouch.
When collecting all your company data, a key part is ensuring that people know what each data point represents. Failure to do this can result in poor decisions and negative business impact.
That’s why building a data taxonomy is so important. It clearly defines a business’s data, so everyone has the same understanding, and discussions can be made without any confusing semantics getting in the way.
What is Data Taxonomy?
Data taxonomy is a way of organizing and classifying data. It involves creating a hierarchy of categories and subcategories that can be used to classify and organize data consistently and logically so datasets can be understood quickly and the same regardless of whoever is looking at it.
The Benefits of Implementing Data Taxonomy
Better Decision-Making
We’ve all been in a situation where the power of hindsight would have been helpful when deciding to create a more positive outcome. However, you can access a similar superpower to help in these situations simply by accessing the correct information.
Getting the correct information to people within your company can provide potential answers or insights without them having to change context into other systems. However, sometimes they might not even know that certain information is available. And even if they know it exists, it could be hidden within a maze of folder structures or on a dashboard the user has forgotten about.
Data taxonomy allows these critical pieces of data to be organized to clarify what they are and how to find them. And better yet, you can use data activation to get the data right into the hands of the person who needs it by sending it into downstream tools using Reverse ETL technology.
Better Clarity and Communication
When the definitions of specific terms are clear, the data’s sources and meanings are clear. With these definitions and data organized, you can achieve more clarity and communication within your business.
A data taxonomy can make essential data more accessible because it’s made clear to more people within your business where it is. For example, for data around product features, it can be embarrassing if a salesperson learns about a new feature of your company from one of your own customers. And there is nothing worse than wasting energy strongly discussing something which isn’t an issue if both of you agree with the definition of a single term.
Data taxonomy can create harmony in your business and ensure everyone sings from the same hymn sheet.
Achieve Better Data Quality
Building a data taxonomy within your business can give you greater confidence in the quality of your data. Because there is a clear understanding of the structure of your data and a consistent naming convention and concise definitions, it can help to avoid errors. It can highlight if there are any inconsistencies in the data.
Avoid Duplication
Another benefit of data taxonomy is the avoidance of duplication. A clear understanding of your data can show you what datasets have been created so you can easily see if what you need already exists. For example, if someone in marketing was looking for the lifetime value of a set of customers, they could check to see if this exists before requesting it.
Looking to modernize your customer data stack?
Download our Complete Guide to the Composable CDP and learn why leading companies are moving beyond traditional CDPs.


How to Build a Data Taxonomy
Now you should understand some benefits of why building a data taxonomy is a worthwhile investment. Now, let’s look at the steps to build a data taxonomy.
Identify the Goals and Objectives of the Taxonomy
The first step is identifying the goals and objectives of building a data taxonomy. This lets you clearly understand what you are trying to achieve and track your progression.
Create a Clear and Consistent Structure for the Data Taxonomy
Next, you need to plan a structure for the data taxonomy. You can see what data might be needed to help achieve your goals and objectives. It would be best to create a data hierarchy where tables contain related and similar information, which is formed logically so it’s easy for anyone to understand.
Define and Classify the Terms and Categories Within the Taxonomy
This may be one of the hardest parts of building a data taxonomy. Once you have an agreed structure, there needs to be an agreement on the terms and categories. You may think this is the easy bit, but in reality, typically, naming things can be a significant cause of debate, and it can be challenging to make sure you’re choosing something clear, concise, and consistent.
You want to try and keep terms and categories as short as possible so they don’t get complicated. Something like “customer_height_collected_via_app_signup_in_CM_to_two decimal_places” is super accurate but contains too much information. A better way of expressing this would be simply “customer_height_CM.”
Another important naming convention is to make things consistent. If you settle on snakecase (where you use “_” to separate words, for example, customer_name), make sure it’s used for everything. If you don’t have consistency, it can be difficult to find specific tables when you need to search for them.
One thing to remember when going through this exercise is you want whatever you name to be clear to everyone, even someone that has never seen the structure before. Going for names such as table1, table2, etc., is not helpful to anyone as it doesn't reveal the table's information.
Implement the Taxonomy in the Appropriate Systems and Platforms
Now you have all the hard work done, it's time to implement your data taxonomy. This could take a lot of work if you're updating your current systems and platforms and may require detailed planning to ensure that you don't run into any issues.
It's ideal to handle this before you start collecting any data, but typically it can be difficult to get buy-in for something that, at first glance, doesn't add value and could add delays. Another challenge is that it might be difficult to know what data you will collect until operations start.
Tips and Best Practices for Creating an Effective Data Taxonomy
Involve Multiple Stakeholders in the Creation Process
It's always a great idea to get all the multiple stakeholders involved in building a data taxonomy, especially those that will update and make amendments. The more these people are engaged with the process, the more likely they will maintain the standard once it is up and running.
Regularly Review and Update the Taxonomy to Reflect Changes in Data and Business Needs
Once you have a data taxonomy in place, it's not the case to set it and forget it. Things can change in your business, from the data you collect to your business’s needs. It makes sense to regularly set time aside to review and update your data taxonomy and make a plan if any future changes may make an impact.
Data Taxonomy Example
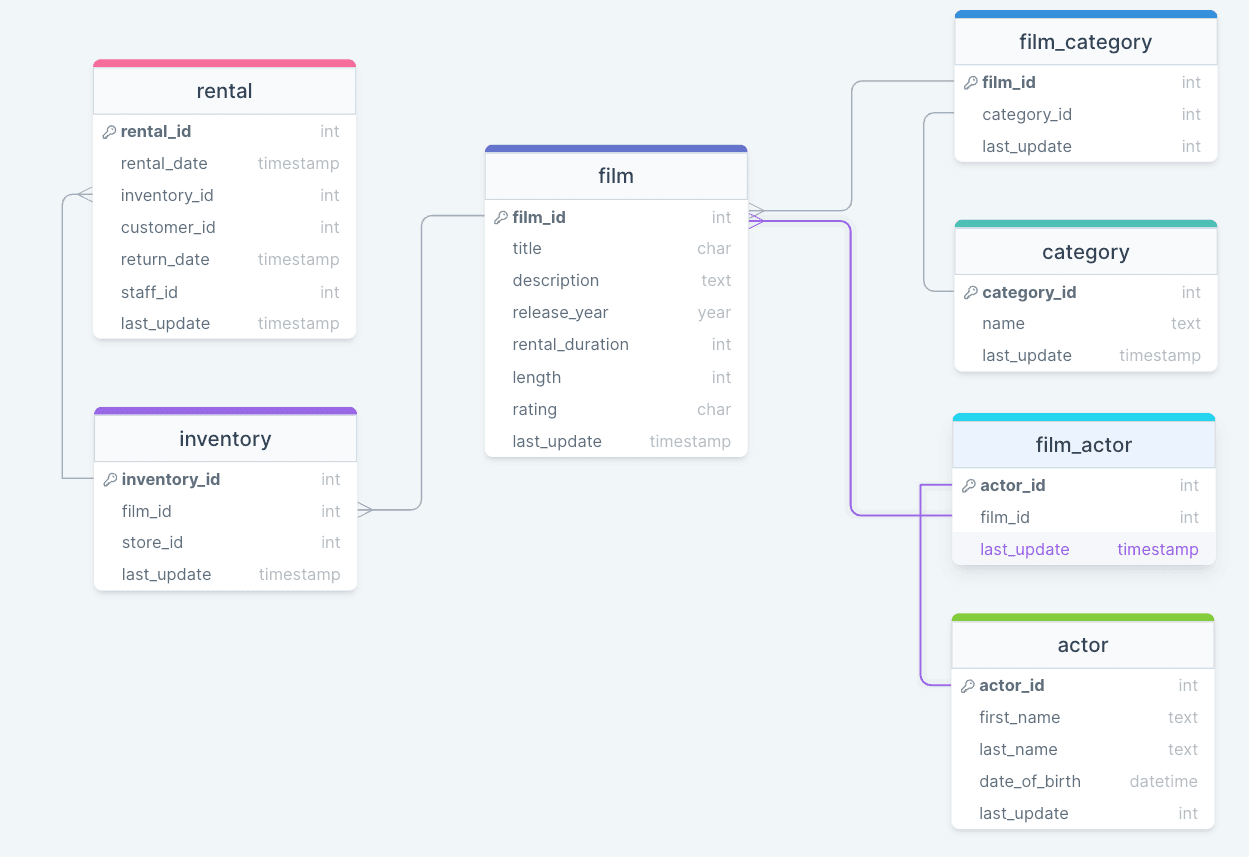
To show you what a potential data taxonomy would look like, here’s a diagram showing the structure of a film rental company and the hierarchy of their data.
Data Taxonomy vs. Other Data Models and Definitions
Data Ontologies
Data ontology is a method of defining the relationship between different entities. It is the attempt to describe everything, which could be tables or the different columns in a database. Data ontology aims to provide a common vocabulary to enable consistency and accuracy. How data taxonomy differs is that data taxonomy focuses on the hierarchy of data rather than on describing what entities of data are.
Data Hierarchies
Data hierarchy organizes data into levels or categories where each level contains different details. The top level represents the most general or abstract information; as you get further down the hierarchy, the information is more specific and detailed.
Data hierarchy is an inherent concept of data taxonomy, which can be visualized in a data taxonomy chart.
Metadata
Metadata is the description of data. It adds context and additional information about the data, including its creation, format, purpose, and location. Metadata helps users to find data easier and use it more effectively. Compared to data taxonomy, metadata provides more detailed information about data than data taxonomy.
Data Classifications
Data classification categorizes data based on different levels, such as its sensitivity, importance, or value. Data classification helps to apply the appropriate level of security and protection to data.
Data taxonomy is a specific sub-discipline of data classification that focuses on giving hierarchy to data by classifying it into a structured system. In this way, data taxonomy is a part of the larger field of data classification.
Data Dictionaries
A data dictionary is a structured collection of metadata that helps describe data and its attributes within a data set. The goal of a data dictionary is to provide clear and descriptive data information that anyone can understand and allows users to understand complex databases without investigating each column individually. Data dictionaries provide a summary of information about the data, while data taxonomy organizes the data into a hierarchical structure.
Data Catalog
A data catalog is a collection of all an organization's data assets. It stores metadata about an organization's data assets, such as each asset's name, description, location, and format, to make searching for what you need easier.
One of the main roles of a data catalog is to help users discover and understand the available data and to facilitate the use and reuse of data across an organization. In contrast, data taxonomy is the way of organizing data.
Data Taxonomy Tools
Data taxonomy tools can be simple. The tool needs to be able to display the data taxonomy structure that you have planned. If your structure is simple enough, you can achieve this with a pen and paper.
Excel is another option that can help you plan your data taxonomy. However, mapping relationships can be difficult.
A great choice for planning and displaying relationships is using a tool like drawSQL. DrawSQL lets you create the needed tables, easily visually organize your data, and show the future relationships between data.
DrawSQL has other benefits, such as leaving notes and easily sharing diagrams with an online link.
Conclusion
Data taxonomy is one of the tasks which often doesn’t get carried out due to the lack of perceived value. However, having access to clean data which a good data taxonomy structure can really make the difference in helping your business understand its data better and more effectively use data to do things like obtain a complete 360-degree view of a customer.
The future of customer data is composable
Traditional CDPs promise a single source of truth but often create silos, limit flexibility, and add complexity. A Composable CDP takes a different approach. By building on top of your existing data warehouse, you get:
- A single, trusted source of data without duplication
- Modular components that fit your current stack
- Greater flexibility and faster time-to-value
- Stronger governance and security controls
Download our Complete Guide to the Composable CDP to understand the shift, the benefits, and how leading enterprises are unlocking personalization at scale.


